

关于LLDB调试,很多iOS开发者可能就是停留在会下简单的断点,使用最多命令也就是po。无可厚非,这些简单的调试对于简单的问题来说应该是游刃有余。但是如果稍微复杂一些的问题,比如我之前遇到过友盟SDK里面的一个问题。我很想往里面下一个断点,可是对于
.a的静态库来说,这根本不可能,最终还是我们组大牛使用命令的方式下了断点解决了这个问题。感觉这些知识很有必要,我于是把LLDB的基本调试命令都学习了一下,并在此与大家分享。
虽然博客很长,不过耐心看完,然后动手实践,一定会有很大帮助。
breakpoint
给某个文件的某一行下断点。可以使用如下两种方法,比如我想给Foo.m文件的26行下一个断点。可以使用如下的方法。
(lldb) breakpoint set --file Foo.m --line 26如果出现如下提示则说明设置断点成功
Breakpoint 2: where = BreakPointDemo`-[Foo foo] + 23 at Foo.m:26, address = 0x000000010b22e687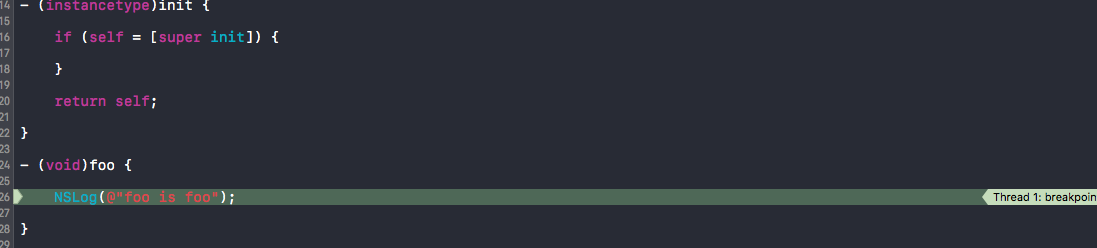
也可以使用简写的形式如下。
(lldb) breakpoint set -f Foo.m -l 26当然我们也可以直接给某个函数下断点,可以使用下面两种方法
(lldb) breakpoint set --name foo
(lldb) breakpoint set -n foo
当然我们也可以在一次命令中为下多个函数下断点
(lldb) breakpoint set --name foo --name bar我们也可以更明确的指定是方法,如果是C的方法,可以使用如下两种的方法打断点,第二种方法M需要大写
(lldb) breakpoint set --method cplusFoo
(lldb) breakpoint set -M cplusFoo
如果是OC的方法,可以使用以下两种方式打断点,第二种S需要大写
(lldb) breakpoint set --selector foo

(lldb) breakpoint set -S foo
如果是C语言,还是只能使用上面介绍的--name的方式,不能直接指定对应的方法
当然,还有一个必杀器,就是使用正则,匹配你要打断点的函数。这个不限语言
(lldb) breakpoint set -r cFoo
(lldb) breakpoint set -r foo
也可以指定加载的动态库
(lldb) breakpoint set --shlib foo.dylib --name foo
(lldb) breakpoint set -s foo.dylib -n foo
我们同样可以对命令进行简写。下面两个命令的效果是一样的
(lldb) breakpoint set -n "-[Foo foo]"
(lldb) br s -n "-[Foo foo]"
想要查看有多少断点可以使用
(lldb) breakpoint list打印的结果如下
Current breakpoints:
1: file = '/Users/jianquan/Xcode/BreakPointDemo/BreakPointDemo/ViewController.m', line = 20, exact_match = 0, locations = 0 (pending)
2: file = '/Users/jianquan/Xcode/BreakPointDemo/BreakPointDemo/ViewController.mm', line = 33, exact_match = 0, locations = 1, resolved = 1, hit count = 0
  2.1: where = BreakPointDemo`::-[ViewController viewDidLoad]() + 186 at ViewController.mm:34, address = 0x0000000105f8362a, resolved, hit count = 0
......
我们可以对断点进行相关的操作,比如在执行到2.1断点的时候打印追踪轨迹。bt是
(lldb) breakpoint command add 2.1
Enter your debugger command(s).  Type 'DONE' to end.
> bt
> DONE
除了add,还要delete等命令,这些命令不需要死记硬背,可以使用help命令。
(lldb) help break command

      add    -- Add LLDB commands to a breakpoint, to be executed whenever the
                breakpoint is hit.  If no breakpoint is specified, adds the
                commands to the last created breakpoint.
      delete -- Delete the set of commands from a breakpoint.
      list   -- List the script or set of commands to be executed when the
breakpoint is hit.要查看更详细的命令用途,使用help <command> <subcommand>.比如查看add命令用法
(lldb) help break command add
......

Enter your Python command(s). Type 'DONE' to end.
> def breakpoint_output (bp_no):
>     out_string = "Hit breakpoint number " + repr (bp_no)
>     print out_string
>     return True
> breakpoint_output (1)
> DONE
可以看到其实这里面的命令大部分是Python脚本,不熟悉Python,暂时还没有仔细研究。
补充一点使用了之后如何删除断点呢,命令说明如下。
breakpoint delete [-Df] [<breakpt-id | breakpt-id-list>]我现在用breakpoint list查我的进程
Current breakpoints:
1: file = '/Users/jianquan/Xcode/BreakPointDemo/BreakPointDemo/ViewController.m', line = 20, exact_match = 0, locations = 0 (pending)


2: file = '/Users/jianquan/Xcode/BreakPointDemo/BreakPointDemo/ViewController.mm', line = 29, exact_match = 0, locations = 1, resolved = 1, hit count = 1

  2.1: where = BreakPointDemo`::-[ViewController viewDidLoad]() + 105 at ViewController.mm:30, address = 0x00000001025b55c9, resolved, hit count = 1

4: name = 'foo', locations = 1, resolved = 1, hit count = 0
  4.1: where = BreakPointDemo`-[Foo foo] + 23 at Foo.m:26, address = 0x00000001025b5517, resolved, hit count = 0

5: regex = 'cFoo', locations = 2, resolved = 2, hit count = 0
  5.1: where = BreakPointDemo`cFoo + 15 at CFoo.c:13, address = 0x00000001025b591f, resolved, hit count = 0
5.2: where = libicucore.A.dylib`icu::MeasureUnit::createCubicFoot(UErrorCode&), address = 0x00000001051b808a, resolved, hit count = 0若果我要删除5.1断点我就使用breakpoint delete 5.1,如果我要删除5下面的所有断点,使用breakpoint delete 5,这样5.1和5.2都会删除。
删除所有的断点使用
(lldb) breakpoint delete
About to delete all breakpoints, do you want to do that?: [Y/n] y
All breakpoints removed. (4 breakpoints)
watchpoint
这个主要是用于观察变量值的具体变化
比如我需要观察某个变量a的值变化,我可以使用如下命令
(lldb) watchpoint set variable a成功添加watchpoint后结果如下。
Watchpoint created: Watchpoint 1: addr = 0x7fff5913ca3c size = 4 state = enabled type = w
    declare @ '/Users/jianquan/Xcode/BreakPointDemo/BreakPointDemo/ViewController.mm:25'
    watchpoint spec = 'a'
    new value: 10
也可以在这里添加.
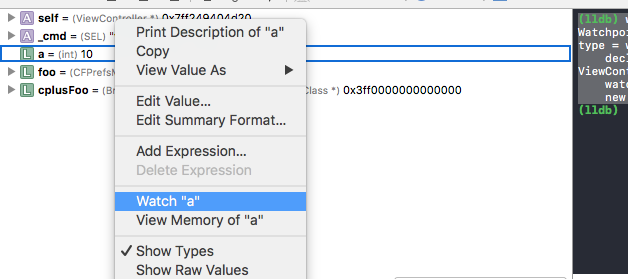
然后我们可以设置在a的值变化为某个特定值之后触。
(lldb) watchpoint modify -c '(a=100)'我们这个时候可以看一下具体断点的参数,使用watchpoint list命令
(lldb) watchpoint list
Number of supported hardware watchpoints: 4
Current watchpoints:
Watchpoint 1: addr = 0x7fff4fcb7a3c size = 4 state = enabled type = w
    declare @ '/Users/jianquan/Xcode/BreakPointDemo/BreakPointDemo/ViewController.mm:25'
    watchpoint spec = 'a'
    new value: 10
condition = '(a=100)'可以看到我们观察的变量的地址,声明变量的代码在第几行,已经具体的变量名是a,当前的值是10,触发的条件是'(a=100)'
然后我们执行如下命令,就可以看到断点到a的值变为100的地方
(lldb) c
Process 16596 resuming
2017-02-09 11:12:14.693 BreakPointDemo[16596:6050498] foo is foo
2017-02-09 11:12:14.693 BreakPointDemo[16596:6050498] bar is bar

Watchpoint 1 hit:
old value: 10
new value: 100可以看到这个地方a的值已经发生改变。我们可以再使用watchpoint list命令看看具体值的变化
(lldb) watchpoint list
Number of supported hardware watchpoints: 4
Current watchpoints:
Watchpoint 1: addr = 0x7fff4fcb7a3c size = 4 state = enabled type = w
    declare @ '/Users/jianquan/Xcode/BreakPointDemo/BreakPointDemo/ViewController.mm:25'
    watchpoint spec = 'a'
    old value: 10
    new value: 100
    condition = '(a=100)'
当然,还有一个特别好用的命令就是bt命令我们可以用它来追踪程序运行的过程。
(lldb) bt
* thread #1: tid = 0x5c52c2, 0x000000010ff465fe BreakPointDemo`::-[ViewController viewDidLoad](self=0x00007f932cc07c50, _cmd="viewDidLoad") + 158 at ViewController.mm:36, queue = 'com.apple.main-thread', stop reason = watchpoint 1
  * frame #0: 0x000000010ff465fe BreakPointDemo`::-[ViewController viewDidLoad](self=0x00007f932cc07c50, _cmd="viewDidLoad") + 158 at ViewController.mm:36
    frame #1: 0x000000011112ba3d UIKit`-[UIViewController loadViewIfRequired] + 1258
 ......
我们可以使用frame命令查看变量a的具体值。
(lldb) frame variable a
(int) a = 100
最后补充一点watchpoint list的东西。这个命令包括了三个可选参数,我们可以使用help命令查看具体的值
(lldb) help watchpoint list

       -b ( --brief )
            Give a brief description of the watchpoint (no location info).

       -f ( --full )
            Give a full description of the watchpoint and its locations.

       -v ( --verbose )
            Explain everything we know about the watchpoint (for debugging
debugger bugs).-b是比较简略的信息,-f是比较全面的信息,-v是完整的信息。经过我的实验,如果使用watchpoint list,默认的是 watchpoint list -f。
process
使用process命令也可以做很多有趣的操作。具体能做什么,我们也可使用help命令查看
(lldb) process help

      attach    -- Attach to a process.
      connect   -- Connect to a remote debug service.
      continue  -- Continue execution of all threads in the current process.
      detach    -- Detach from the current target process.
      handle    -- Manage LLDB handling of OS signals for the current target
......查看更详细的命令使用help <command> <subcommand>。比如
(lldb) help process attach这些命令在我目前日常开发中其实不怎么使用,可能我功力还不足吧。
thread
其实这个功能主要就是断点调试里面的如下这个功能。
我们可以使用thread命令来做一些断点的操作,具体有那些命令我们可以使用thread help进行查看。
(lldb) thread help

      ......

      select         -- Change the currently selected thread.
      step-in        -- Source level single step, stepping into calls.
                        Defaults to current thread unless specified.
      step-inst      -- Instruction level single step, stepping into calls.
                        Defaults to current thread unless specified.
      step-inst-over -- Instruction level single step, stepping over calls.
                        Defaults to current thread unless specified.
      step-out       -- Finish executing the current stack frame and stop after
                        returning.  Defaults to current thread unless
                        specified.
      step-over      -- Source level single step, stepping over calls.
                        Defaults to current thread unless specified.
      step-scripted  -- Step as instructed by the script class passed in the -C
                        option.
      until          -- Continue until a line number or address is reached by
                        the current or specified thread.  Stops when returning
                        from the current function as a safety measure.
用得比较多的应该是 step-开头的这几个命令,使用起来很容易。我个人感觉比用鼠标点击断点好用多了~
EXAMINING THREAD STATE
这个使用的也主要还是thread命令,主要是使用以下几个命令。
检查当前进程的状态,可以使用如下命令。
lldb)  thread list
Process 22323 stopped
* thread #1: tid = 0x62d0d7, 0x00000001082185fe BreakPointDemo`::-[ViewController viewDidLoad](self=0x00007ff81b60ab20, _cmd="viewDidLoad") + 158 at ViewController.mm:36, queue = 'com.apple.main-thread', stop reason = step until
...... *表明的就是当前的线程,可以使用如下的命令得到线程的回溯,这个词我也不确定怎么表达好,backtrace,也可以说是追踪。
 lldb) thread backtrace
* thread #1: tid = 0x62d0d7, 0x00000001082185fe BreakPointDemo`::-[ViewController viewDidLoad](self=0x00007ff81b60ab20, _cmd="viewDidLoad") + 158 at ViewController.mm:36, queue = 'com.apple.main-thread', stop reason = step until
  * frame #0: 0x00000001082185fe BreakPointDemo`::-[ViewController viewDidLoad](self=0x00007ff81b60ab20, _cmd="viewDidLoad") + 158 at ViewController.mm:36
    frame #1: 0x00000001093fda3d UIKit`-[UIViewController loadViewIfRequired] + 1258
    frame #2: 0x00000001093fde70 UIKit`-[UIViewController view] + 27
    frame #3: 0x00000001092c74b5 UIKit`-[UIWindow addRootViewControllerViewIfPossible] + 71
    frame #4: 0x00000001092c7c06 UIKit`-[UIWindow _setHidden:forced:] + 293
    frame #5: 0x00000001092db519 UIKit`-[UIWindow makeKeyAndVisible] + 42
    frame #6: 0x0000000109253f8d UIKit`-[UIApplication _callInitializationDelegatesForMainScene:transitionContext:] + 4818
    frame #7: 0x000000010925a0ed UIKit`-[UIApplication _runWithMainScene:transitionContext:completion:] + 1731
    frame #8: 0x000000010925726d UIKit`-[UIApplication workspaceDidEndTransaction:] + 188
    frame #9: 0x000000010c3886cb FrontBoardServices`__FBSSERIALQUEUE_IS_CALLING_OUT_TO_A_BLOCK__ + 24
    frame #10: 0x000000010c388544 FrontBoardServices`-[FBSSerialQueue _performNext] + 189
    frame #11: 0x000000010c3888cd FrontBoardServices`-[FBSSerialQueue _performNextFromRunLoopSource] + 45
    frame #12: 0x0000000108ddc761 CoreFoundation`__CFRUNLOOP_IS_CALLING_OUT_TO_A_SOURCE0_PERFORM_FUNCTION__ + 17
    frame #13: 0x0000000108dc198c CoreFoundation`__CFRunLoopDoSources0 + 556
    frame #14: 0x0000000108dc0e76 CoreFoundation`__CFRunLoopRun + 918
    frame #15: 0x0000000108dc0884 CoreFoundation`CFRunLoopRunSpecific + 420
    frame #16: 0x0000000109255aea UIKit`-[UIApplication _run] + 434
    frame #17: 0x000000010925bc68 UIKit`UIApplicationMain + 159
    frame #18: 0x000000010821899f BreakPointDemo`main(argc=1, argv=0x00007fff579e7600) + 111 at main.m:14
frame #19: 0x000000010bbee68d libdyld.dylib`start + 1当然我们如果想看所有线程的backtrace,可以使用thread backtrace all命令。内容太多,我这里就不演示log输出了。
如果我们想单独查看某个线程,我们可以先使用thread select 2跳到某个具体的线程,然后再进行其他操作,比如thread backtrace
EXAMINING STACK FRAME STATE
为了方便的观测架构参数和本地变量,我们可以使用 frame variable 命令
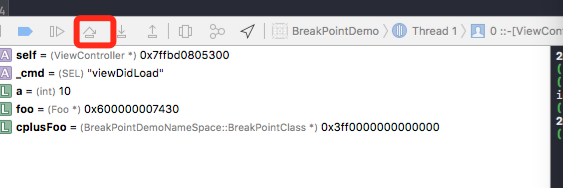
如果我什么参数也不加,将会把所有的参数和本地变量到打印出来。
(lldb) frame variable
(ViewController *) self = 0x00007ff81b60ab20
(SEL) _cmd = "viewDidLoad"
(int) a = 100
(Foo *) foo = 0x000061800000e820
(BreakPointDemoNameSpace::BreakPointClass *) cplusFoo = 0x3ff0000000000000
要打印某个变量需要在参数里面指定,这个命令我们在前面也使用过,比如要查看self
(lldb) frame variable self
(ViewController *) self = 0x00007ff81b60ab20
更进一步,我们可以查看一些子元素
(lldb) frame variable self->isa
(Class) self->isa = ViewController
命令虽然不是完整的表达式解释器,当时可以识别一些基本的操作 比如 &, *, ->, [],不是重载运算符,数组也可以使用,因为数组本身也是指针。
(lldb) frame variable *self

(ViewController) *self = {
  UIViewController = {
    UIResponder = {
      NSObject = {
        isa = ViewController
      }
    ......
}和之前thread命令很类似,我可以使用frame select去选择另外的一个frame
(lldb) frame select 9如果想看更复杂的数据,我们可以使用expression命令
(lldb) expression self
(ViewController *) $0 = 0x00007fefa4705110
更复杂一些,我们可以用来输出一个表达式
(lldb) expr (int) printf ("I have a pointer 0x%llx.\n", self)
I have a pointer 0x7fefa4705110.
(int) $1 = 33
我们可以继续以之前的命令来操作
(lldb) expr self = $0
(ViewController *) $2 = 0x00007fefa4705110
当然这个expr用途感觉不大。
call
其实这个命令完全可以使用po进行替代,call一般可以用来调用不需要返回值的调试命令,比如更改View的背景颜色,以下两个命令都可以达到相似的作用,更改当前View的背景颜色值。
(lldb) po [self.view setBackgroundColor:[UIColor redColor]]
(lldb) call [self.view setBackgroundColor:[UIColor redColor]]
image
虽然只是一个简单的命令,但是我还是感觉这是一个比较重要也比较实用的命令, 命令可用于寻址。比较实用的用法是用于寻找栈地址对应的代码位置。 下面我写了一段代码
  //测试image命令使用
    NSArray *arr=[[NSArray alloc] initWithObjects:@"1",@"2", nil];
    NSLog(@"%@",arr[2]);
可以很明显的看到数组越界了,然后我们运行程序,可以看到程序报如下错误
this is cplusFoothis is cFoo2017-02-09 16:33:52.143 BreakPointDemo[26121:6901793] *** Terminating app due to uncaught exception 'NSRangeException', reason: '*** -[__NSArrayI objectAtIndex:]: index 2 beyond bounds [0 .. 1]'
*** First throw call stack:
(
    0   CoreFoundation                      0x0000000104d67d4b __exceptionPreprocess + 171
    1   libobjc.A.dylib                     0x000000010471e21e objc_exception_throw + 48
    2   CoreFoundation                      0x0000000104ca22bb -[__NSArrayI objectAtIndex:] + 155
    3   BreakPointDemo                       -[ViewController viewDidLoad] + 340
    4   UIKit                               0x000000010675ba3d -[UIViewController loadViewIfRequired] + 1258
    5   UIKit                               0x000000010675be70 -[UIViewController view] + 27
    6   UIKit                               0x00000001066254b5 -[UIWindow addRootViewControllerViewIfPossible] + 71
    7   UIKit                               0x0000000106625c06 -[UIWindow _setHidden:forced:] + 293
    8   UIKit                               0x0000000106639519 -[UIWindow makeKeyAndVisible] + 42
    9   UIKit                               0x00000001065b1f8d -[UIApplication _callInitializationDelegatesForMainScene:transitionContext:] + 4818
    10  UIKit                               0x00000001065b80ed -[UIApplication _runWithMainScene:transitionContext:completion:] + 1731
    11  UIKit                               0x00000001065b526d -[UIApplication workspaceDidEndTransaction:] + 188
    12  FrontBoardServices                  0x00000001083456cb __FBSSERIALQUEUE_IS_CALLING_OUT_TO_A_BLOCK__ + 24
    13  FrontBoardServices                  0x0000000108345544 -[FBSSerialQueue _performNext] + 189
    14  FrontBoardServices                  0x00000001083458cd -[FBSSerialQueue _performNextFromRunLoopSource] + 45
    15  CoreFoundation                      0x0000000104d0c761 __CFRUNLOOP_IS_CALLING_OUT_TO_A_SOURCE0_PERFORM_FUNCTION__ + 17
    16  CoreFoundation                      0x0000000104cf198c __CFRunLoopDoSources0 + 556
    17  CoreFoundation                      0x0000000104cf0e76 __CFRunLoopRun + 918
    18  CoreFoundation                      0x0000000104cf0884 CFRunLoopRunSpecific + 420
    19  UIKit                               0x00000001065b3aea -[UIApplication _run] + 434
    20  UIKit                               0x00000001065b9c68 UIApplicationMain + 159
    21  BreakPointDemo                      0x000000010414794f main + 111
    22  libdyld.dylib                       0x00000001062b068d start + 1
    23  ???                                 0x0000000000000001 0x0 + 1
)

libc++abi.dylib: terminating with uncaught exception of type NSException我们大概可以猜测程序是崩溃在第三行log,也就是地址为0x0000000104147544的地方,怎么来呢,瞎猜的,哈哈。其实原理很简单,因为我的Demo名字叫BreakPointDemo。其他的名字很明显是系统的库。虽然log的21行也有BreakPointDemo,但是经过观察应该是main函数,不在考虑范围之内。
我们使用image 的 lookup命令,可以很快的定位到具体的代码行。
(lldb) image lookup --address 0x0000000104147544
      Address: BreakPointDemo[0x0000000100001544] (BreakPointDemo.__TEXT.__text + 644)
      Summary: BreakPointDemo`::-[ViewController viewDidLoad]() + 340 at ViewController.mm:46
看看我们的Xcode文件的代码。确实是46行

当然还有很多的命令我们可以探索,使用image help可以查看,这些命令我暂时没有接触过,后续工作或者学习中使用到了我会更新上来。
为命令设置别名
比如p是frame variable的别名,p view实际上是frame variable view。除了系统自建的LLDB别名,你也可以自定义别名。比如下面这个命令。掌握了规律之后,任何的命令我们都可以自己设置别名。
(lldb) command alias bfl breakpoint set -f %1 -l %2
(lldb) bfl Foo.m 12
如果想要撤销别名使用
(lldb) command unalias bfl当然还有一些LLDB的具体命令,我们可以在官网查看: The LLDB Debugger
总结
这么长的文章,看到这里真的不容易,不过我相信你应该有所收获了。另外我的博客长期欢迎评论留言,相互探讨,不足之处欢迎批准指正。
