

Introducing DataViz a data-structure visualization library for Golang
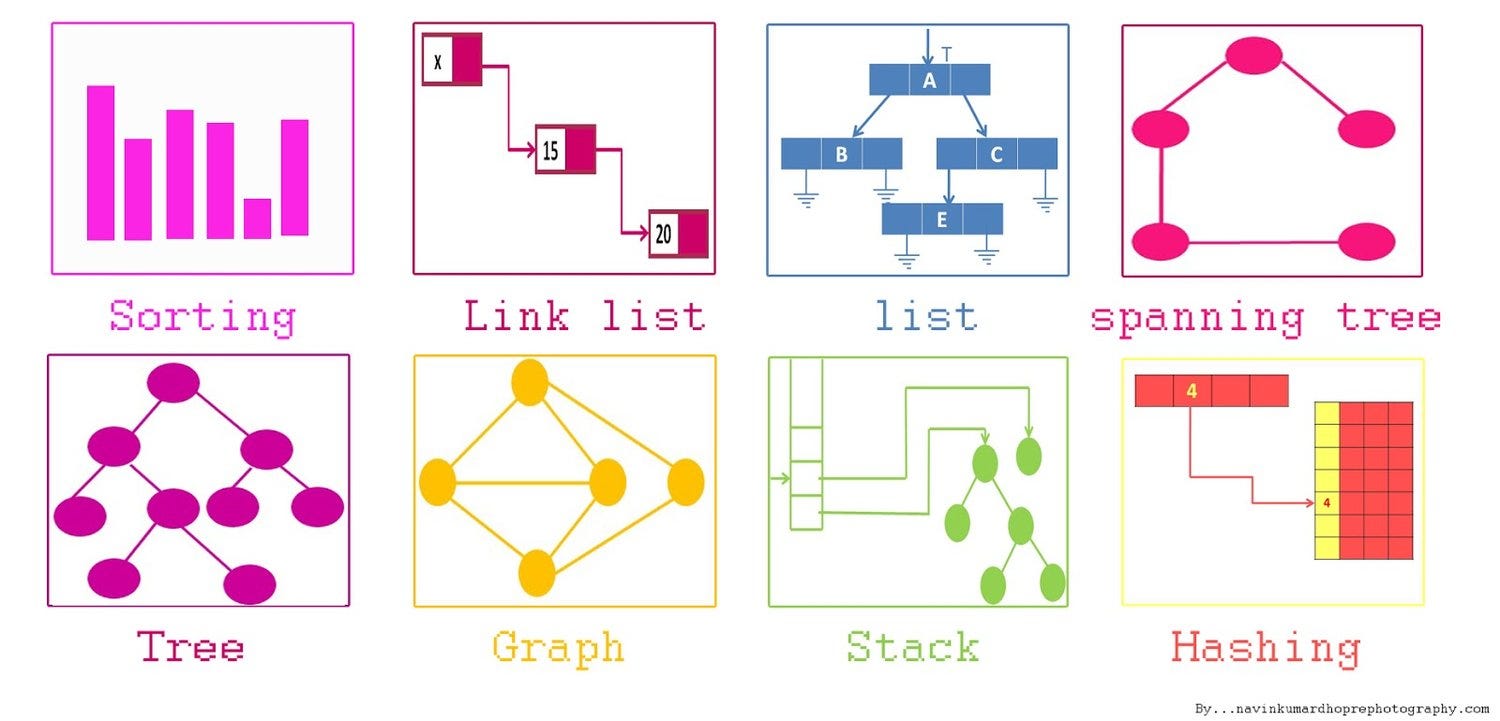
As someone who really loves solving cool problems with complex data structures, I really can’t emphasize how important data structures are to becoming a good software developer. I myself learnt and understood basic data structures many years ago.
As a software developer one of my most important realizations is that the skills I developed from understanding and implementing data-structures had many positive cascading effects on my career as a developer.
And no, I am not just talking about being able to ace the programming interviews at investment banks or tech companies but also being able to understand many complicated core computer science concepts ranging from Operating Systems, Networking and Distributed Systems, etc. I don’t really code algorithms from scratch in my job because I can always use over-optimized heavily tested libraries like Boost but the ideas I learnt before are something that will stay with my forever.
One of the most classic problems that CS educators face these days is to be able to help students understand and implement the data structures and I figured that since I have some time to hack a few things together, I might as well take a shot at building a cool library that helps us do exactly that. So, now coming back to the main question of this blog post.
What is Dataviz?
Dataviz is a data structure visualization library that helps to build and understand standard data structures with added visualizations developed by Graphviz. It’s supplemented with many examples to help you learn and visualize how data structures work.
So let’s start with the simple example of heaps
What are heaps?

Now, I could go on and explain how the heap data structure works but that would certainly take a lot of time and deviate us from the main focus of the post. So for those of you who would like to understand heaps more closely, I would recommend this blogpost from Base-Cs series. Basically, heap supports O(Log N) insertion and O(Log n ) deletion and O(1) retrieval of the top element.
For now, let’s directly jump into Dataviz code and build a heap
This function outputs a simple png file that visualizes our heap.

The good thing about visualizations is that it not only enables you to see the current state of a data structure but how it grows and shrinks. So if we to pop elements from the heap until it’s empty we can see something like the gif below

This is really cool. Note that Dataviz support all kinds of standard heap operations like push, pop, empty, clear, size, top and other features like inverse comparator functions etc.
Lets take a look at a relatively more complicated data structure namely red black trees which are used to implement Maps in C++.
What is red-black Tree?
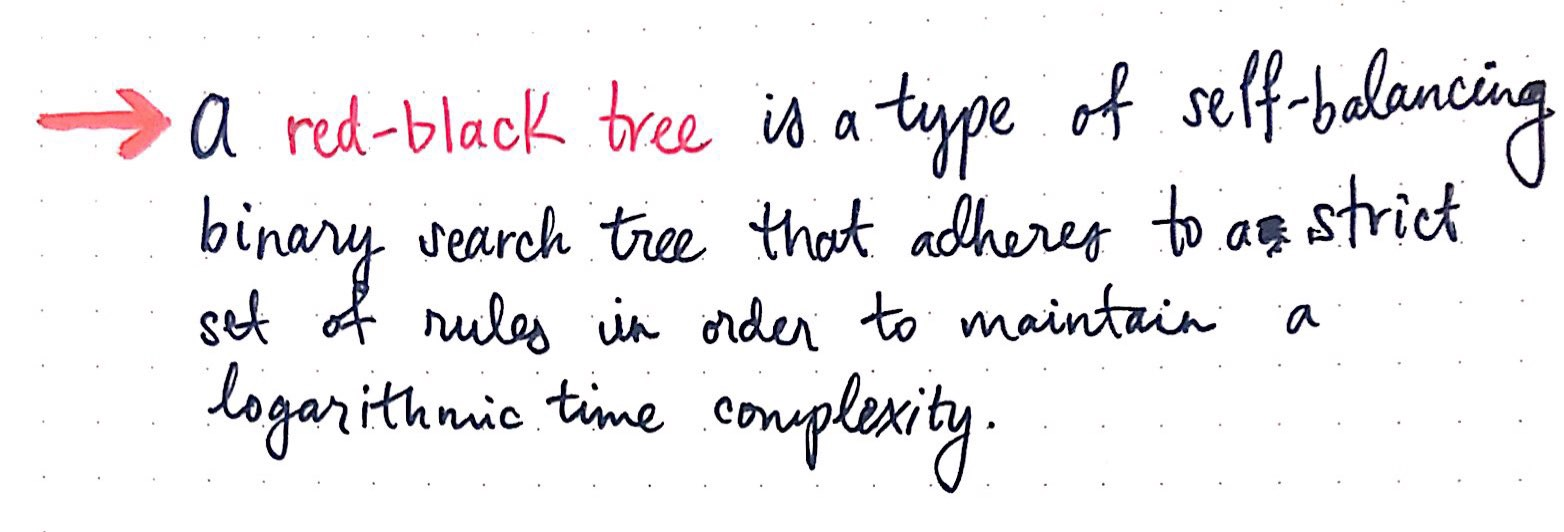
The real take away for red black trees is that they support insertion, deletion and search all within O(log N) worst case. You can read a ton about the interesting ideas behind red-black trees in this post. For now, Let’s just try to code and see how we can map a few numbers to a few characters and how to visualize it.

This makes a simple file like this

We can also understand how to incrementally build and see how every a red black tree is built up with the addition of new nodes. It’s also important to note that the red black tree has a few properties
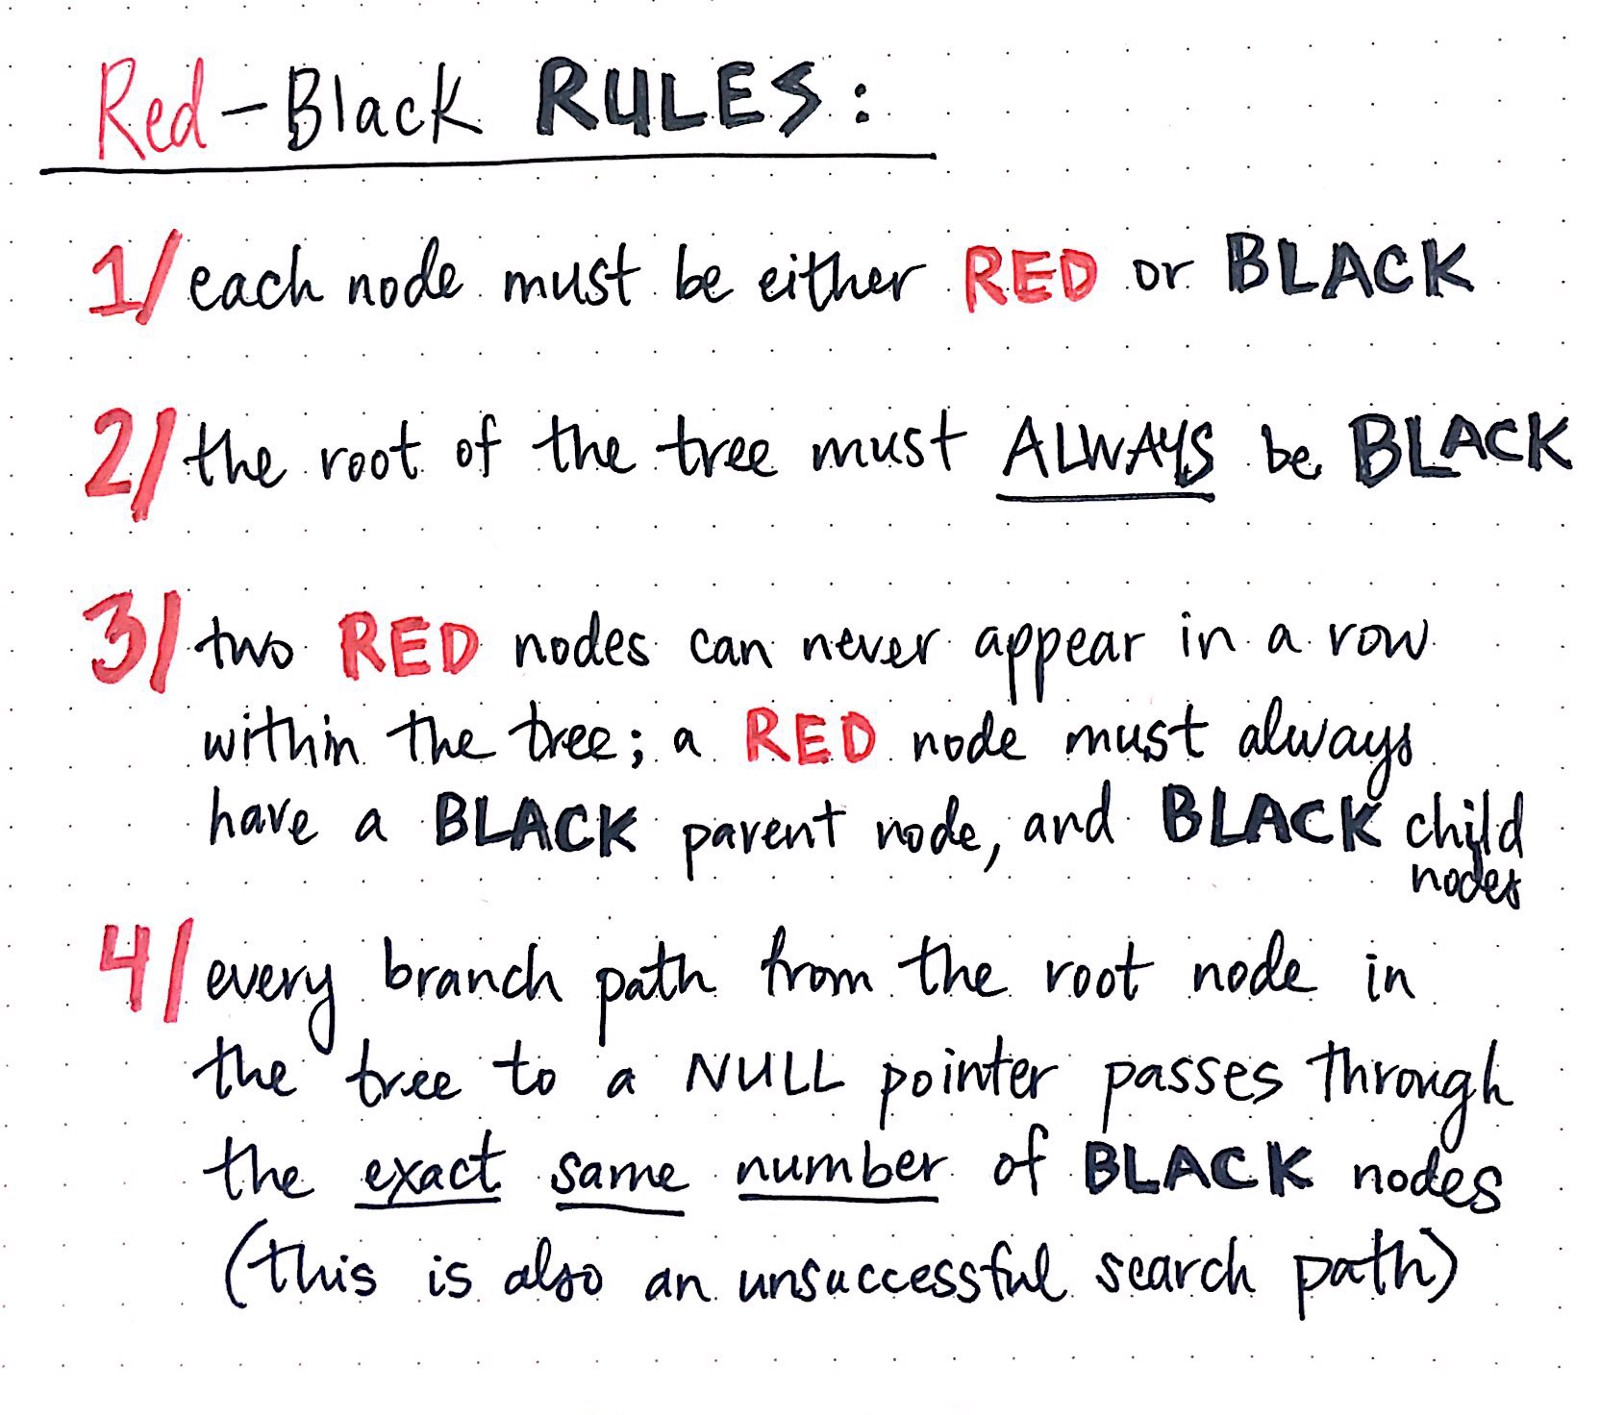
The Gif below shows the process of incrementally building a red black tree. Notice how every single rule mentioned above is satisfied in all the trees below. You can best understand how to build Red black tree by referring to this blog post.

What else can we do with dataviz?
Actually, a whole lot more than this blog post can show you.
We can build Stacks, AVL Trees, BTrees and a lot more.


So that’s about it for DataViz today, I encourage the Cs educators/students to try out the package and see if you can find some great use of it. Feel free to ask for more questions about the package and request for more features.
Acknowledgements
Thanks to my friends who helped with the drafts. I am especially thankful to Emir Pasic for his contribution to Gods Data structure library and other golang gems.
Feature requests
Checkout Dataviz on Github. My ultimate goal is to make DataViz super evolved by adding graph construction of all types and make algorithms tutorials for students with it. Please let me know if you would like to see visualizations for any cool data structures.
Have a great day!!!
