In Uber’s New York engineering office, our Observability team maintains a robust, scalable metrics and alerting pipeline responsible for detecting, mitigating, and notifying engineers of issues with their services as soon as they occur. Monitoring the health of our thousands of microservices helps us ensure that our platform runs smoothly and efficiently for our millions of users across the globe, from riders and driver-partners to eaters and restaurant-partners.
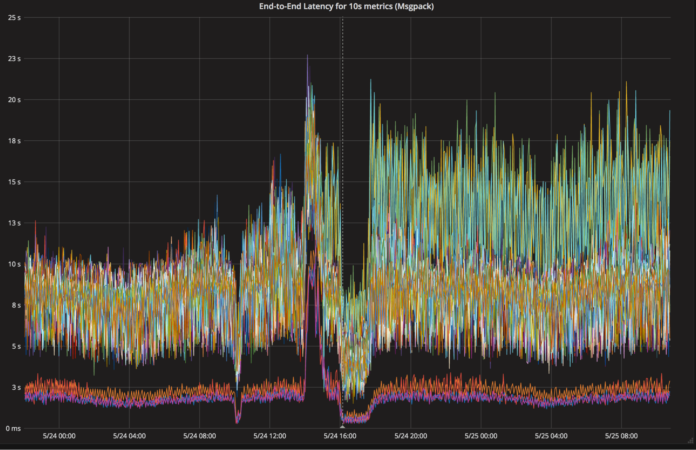
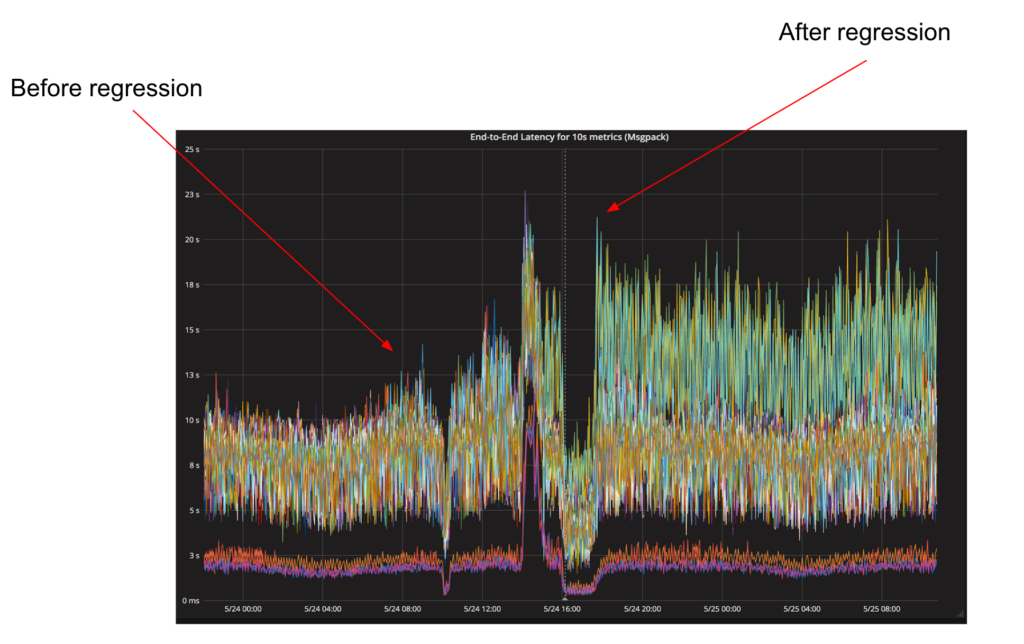
A few months ago, a routine deployment in a core service of M3, our open source metrics and monitoring platform, caused a doubling in overall latency for collecting and persisting metrics to storage, elevating the metrics’ P99 from approximately 10 seconds to over 20 seconds. That additional latency meant that Grafana dashboards about metrics related to our internal systems would take longer to load, and our automated alerts to system owners would take longer to fire. Mitigating the issue was simple–we just reverted to the last known good build, but we still needed to figure out the root cause so we could fix it.
While a lot has been written about how to analyze the performance of software written in Go, most discussions conclude with an explanation of how visualizing CPU and heap profiles with pprof diagnosed and resolved the issue. In this case, our journey began with CPU profiles and pprof but quickly went off the rails when those tools failed us and we were forced to fall back on more primitive tools like git bisect, reading Plan 9 assembly, and yes, forking the Go compiler.
Observability at Uber
Uber’s observability team is responsible for developing and maintaining Uber’s end-to-end metrics platform. Within our ingestion platform’s architecture, depicted in Figure 2, below, applications on our hosts emit metrics to a local daemon (“collector”) which aggregates them at one second intervals and then emits them to our aggregation tier, which further aggregates them at 10 second and one minute intervals. Finally, they are written to the M3DB ingester whose primary responsibility is to write them to our storage tier, M3DB.

Due to the nature of how M3 does aggregation on ingest, the ingesters receive large batches of metrics in the form of pre-aggregated tiles at regular intervals, as shown in Figure 3, below:

As a result, the M3DB ingesters behave like a makeshift queue, and the rate at which the ingesters can write these metrics to M3DB controls our end-to-end latency. Keeping the end-to-end latency of this service low is important because the latency controls how fast internal teams at Uber will be able to view their most recent metrics, as well as how quickly our automated alerts can detect failures.
Bisecting production
When a routine deployment of the M3DB ingestors doubled the end-to-end latency of this service, we started with the basics. We took a CPU profile of the service running in production and visualized it as a flame graph using pprof. Unfortunately, nothing in this flame graph stood out as a cause.
Since we didn’t see anything obvious in the CPU profiles, we decided that our next step should be to identify the commit that introduced the regression, and then we could review the specific code changes. This turned out to be more difficult than expected for a few reasons:
- The M3DB ingesters had not been deployed for a few months, over which time quite a few code changes had been made. Identifying exactly which change caused the problem would be difficult because the code for the ingester service (and all of our team’s other services) is stored in a monorepo, making the commit history very noisy, with many commits unrelated to the service at all. However, these unrelated commits may affect dependencies or cause issues in an indirect way.
- The regression only manifested in production workloads, where traffic tends to be spiky, and under heavy load. As a result, we were not able to reproduce it locally with micro-benchmarks or in our staging/test environments.
As a result, we decided the best way to identify the bad commit was to perform a git bisect, a binary search of our commit history, in production. While we did eventually identify the bad commit, even the git bisect turned out to be much more difficult than we expected, as the bad commit turned out to be in a dependency of a dependency, which meant we had to perform a three-level git bisect. In other words, we narrowed the issue down to a commit in our internal monorepo that changed the version of an open source dependency (M3DB), then narrowed it down to a commit in that repository that changed the version of one of its dependencies (M3X), which meant that we had to git bisect that repository as well.
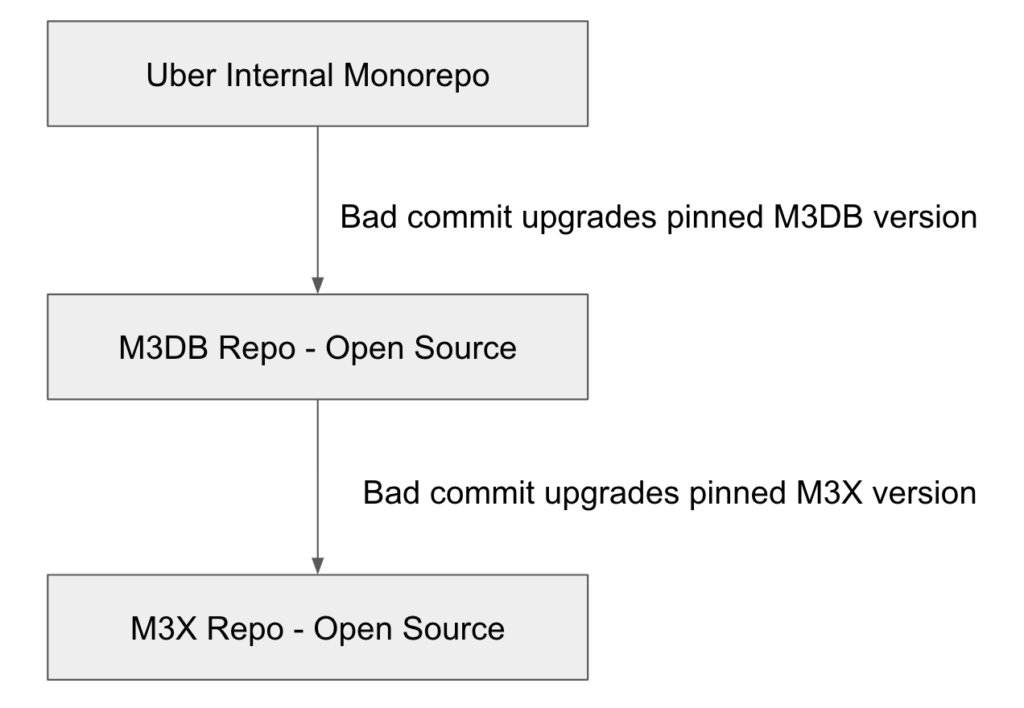
When everything was said and done, we had to deploy our service 81 times to find the bad commit and narrow the performance regression to a small change we had made to the Clone method, shown in Figure 5, below:
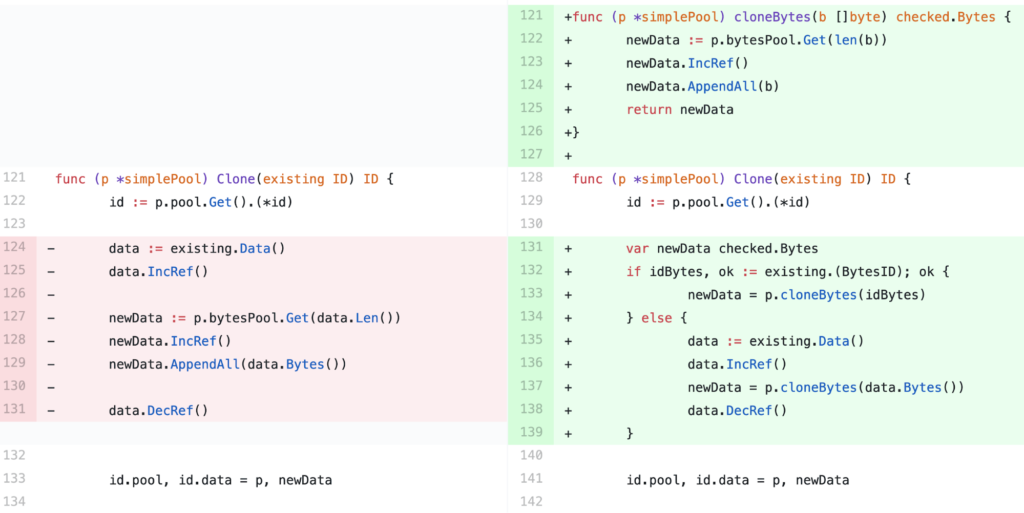
It was difficult for us to believe that this seemingly innocuous change could have doubled our end-to-end latency, but we couldn’t ignore the evidence. If we deployed our service with the code on the left (Figure 5), the performance regression disappeared, and if we deployed it with the code on the right (also Figure 5), it returned.
From determining what to asking why
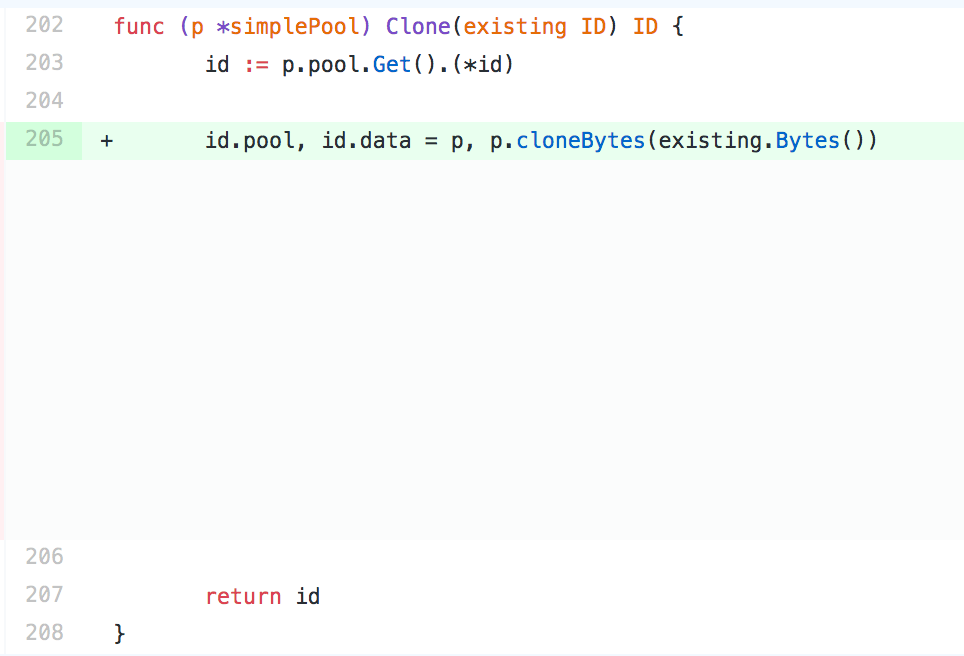
After discovering what caused this change, we set out to determine why this change had such a dramatic impact on performance. First, we evaluated whether some of the more obvious aspects of change could be the issue, like the fact that the type conversion was introducing an additional allocation, or maybe the extra conditional statement was disrupting the CPU’s branch prediction. Unfortunately, we disproved both these theories very quickly with microbenchmarks. In fact, there was no discernible difference in performance between these two functions in our benchmarks at all, which also seemed to rule out function call overhead as a potential issue. In addition, even after further simplifying the new code, as shown in Figure 6, below, we were still seeing the regression in our production deployments:
We weren’t sure what to do next because we had already compared CPU profiles for both commits and they showed no difference in the amount of time spent in the Clone method. As a last ditch effort, we decided to compare the Go assembly for each of the two implementations. We used objdump to inspect our production binaries by running the following command:
go tool objdump -S <PATH_TO_BINARY_WITH_REGRESSION> | grep /ident/identifier_pool.go -A 500
The resulting output looked like this:
The generated assembly for the two functions had subtle differences, such as register allocation, but we didn’t notice anything that might have a large impact on performance except for the fact that the cloneBytes helper function was not being inlined. We weren’t willing to believe that the function call overhead was the source of the issue, especially since it didn’t seem to affect the microbenchmarks, but it was the only meaningful difference between the two implementations that seemed like it could have any impact.
When we inspected the assembly for the cloneBytes function we noticed that it made calls to the runtime.morestack function, as shown below:
This is unsurprising because the Go compiler has to insert these function calls for functions that it can’t prove won’t outgrow the stack (more on that later), but it did draw our attention back to a discrepancy we’d observed earlier in the amount of time spent in the runtime.morestack function, as shown in Figure 7, below:
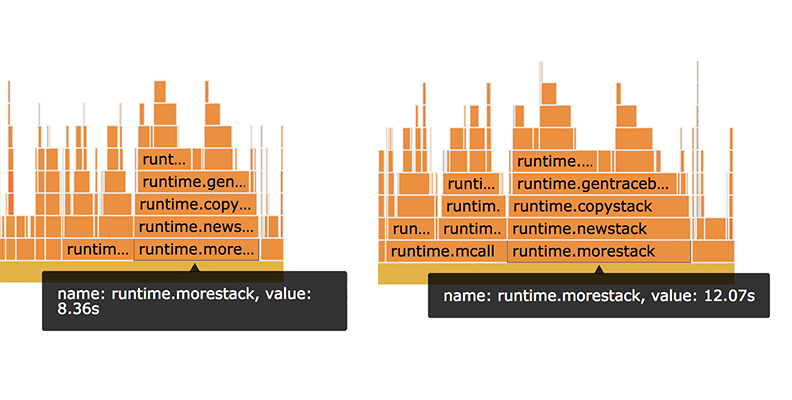
The flame graph on the left (Figure 7) shows how much time was spent in the runtime.morestack function before the regression was introduced, and the one on the right shows how much it spends in that function after. When we originally examined the CPU profiles, we neglected this discrepancy because it was in the runtime code, which we didn’t control, and because we were fixated on trying to identify a difference in the performance of the Clone method that we did control. This is actually a massive difference; the code with the regressions spends 50 percent more time in this function, and four seconds out of 74 seconds of CPU execution time is significant enough to explain our slowdown.
Understanding the Go runtime
But what is this function doing? To understand that, we needed to understand how the Go runtime manages goroutine stacks.
Every goroutine in Go starts off with a 2 kibibyte stack. As more items and stack frames are allocated and the amount of stack space required exceeds the allocated amount, the runtime will grow the stack (in powers of 2) by allocating a new stack that is twice the size of the previous one, and copying over everything from the old stack to the new one.
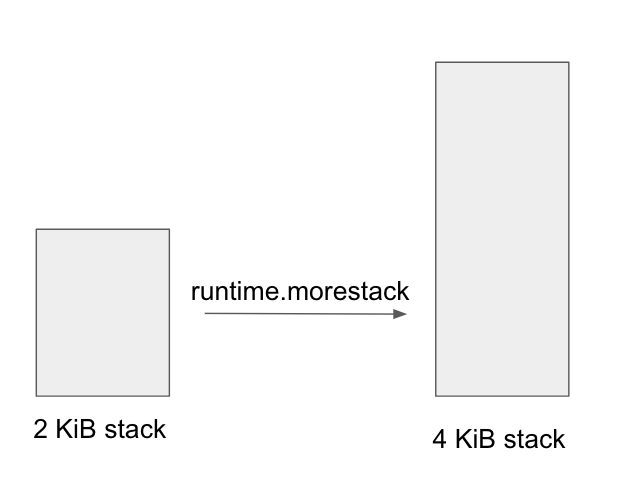
This gave us a new theory: the existing code was running very close to the border of having to grow its stack, and the additional call to the cloneBytes helper method was pushing it over the edge and causing an additional stack growth to happen.
This growth would be sufficient to cause the regression we were seeing, aligned with our CPU profiles, and also explained why were unable to reproduce the issue with our microbenchmarks. When we ran the microbenchmarks, our call stack was very shallow, but in production the Clone method was called 30 function calls deep (as depicted in Figure 9). As a result, the performance discrepancy would only be observed within the specific context that we were calling the function.
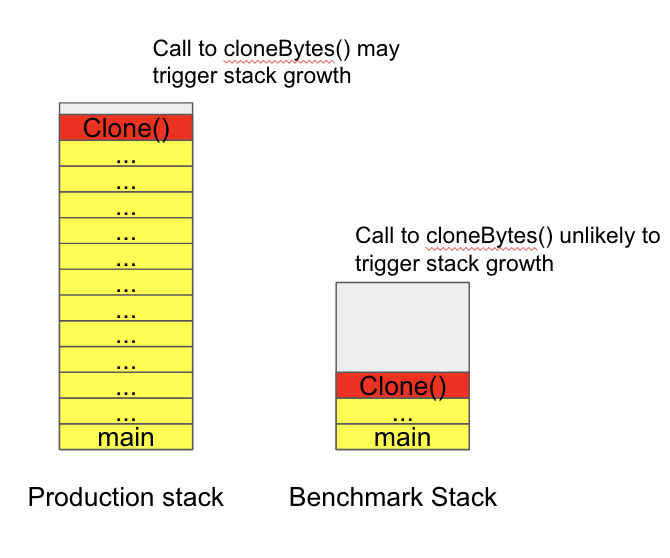
We wanted a quick and easy way to try and validate this theory. The way the M3DB ingester works is that all of the heavy lifting of writing the metrics to M3DB is executed by goroutines created by a single instance of this worker pool.
The important code is reproduced in Figure 10, below:
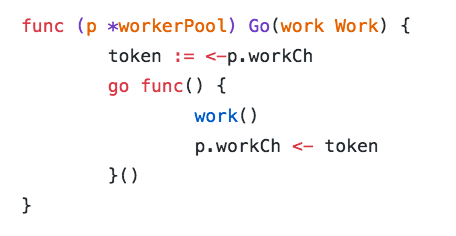
For every incoming batch of writes, we allocate a new goroutine. The work channel, noted as the workCh variable acts as a semaphore, limiting the maximum number of goroutines that can be active at any one time. This lets the ingesters behave like a queue and buffer our spiky workload so that even though the number of metrics being sent to the M3DB ingesters is very spiky, the writes received by M3DB are smoothed out over a longer period of time.
If our theory was correct, then we could alleviate the issue by reusing goroutines instead of constantly spawning new ones. While the Go runtime initially allocates a 2 kibibyte stack for each new goroutine and grows them as necessary, it will never deallocate the expanded stack until the goroutine is garbage collected. (The truth behind how this works is actually a little more complicated. There are some scenarios in which the runtime may try to “move” the routine to a smaller stack, but statistically speaking, the probability of a goroutine needing to grow its stack for any given function call is much lower).
To test our theory, we wrote a new worker pool that spawns all of the goroutines upfront and then uses several different “work channels” (to reduce lock contention) to distribute work to the goroutines instead of creating a new one for each request.
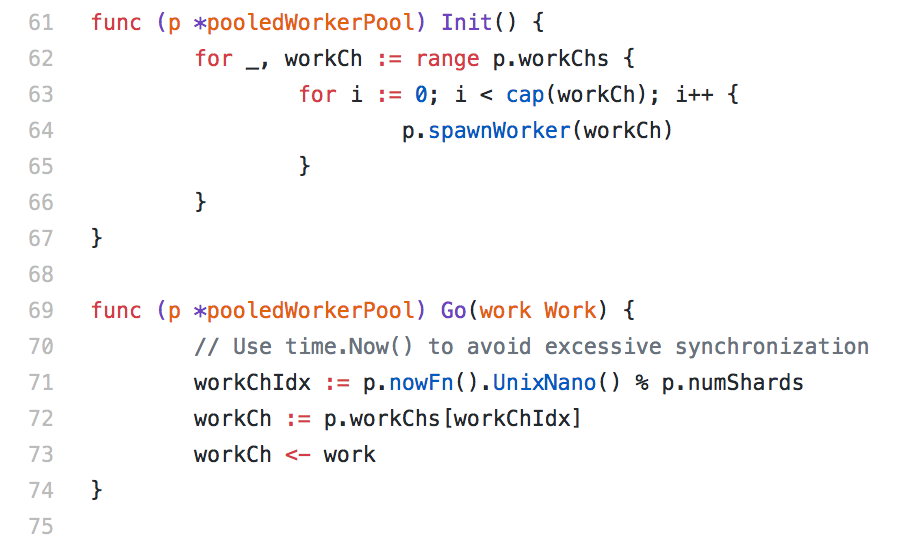
We hypothesized that this approach should prevent the excessive amount of stack growth that was occurring with our existing implementation. While each goroutine would still need to grow its stack the first time it ran the problematic code, on subsequent calls it should just be able to extend its stack frame into the already allocated memory without incurring the cost of an additional heap allocation and stack copy.
Just to be safe, we also included a small probability for each goroutine to terminate and spawn a replacement for itself every time it completed some work to prevent goroutines with excessively large stacks from being retained in memory forever. This additional precaution was probably overzealous, but we’ve learned from experience that only the paranoid survive.
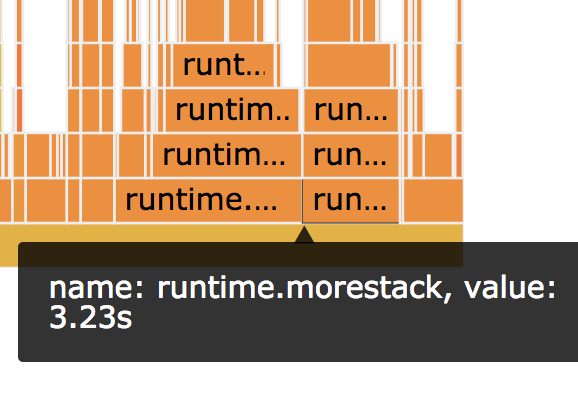
We deployed our service with the new worker pool and were happy to see that the amount of time spent in the runtime.morestack function dropped significantly, as depicted in Figure 12, below:
In addition, our end-to-end latency actually dropped even further than it was before we introduced the regression, as shown in Figure 13, below:
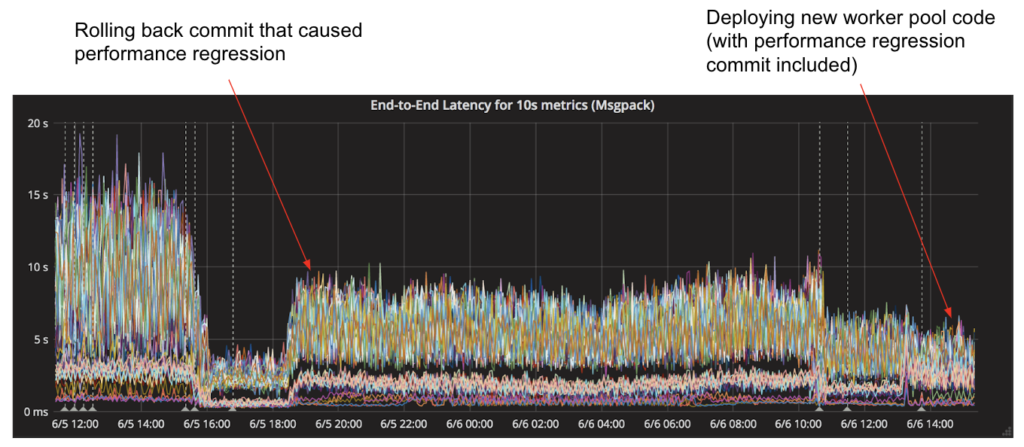
Interestingly, once we started using the new worker pool implementation, it didn’t matter which version of the Clone() method we used as performance was the same regardless of whether the cloneBytes() helper was inlined or not. This was promising because it meant that future engineers would not need to worry about their changes reintroducing this issue, and it also lent additional credence to our stack growth theory.
Finding the smoking gun
Even after seeing these results, we felt like we hadn’t sufficiently proven the root cause of the performance regression. For example, what if our performance savings were just the result of not having to constantly spawn new goroutines or some other process we did not fully understand yet?
Around that time, we stumbled upon this github issue in which an engineer from the CockroachDB team ran into a similar performance issue related to large stack sizes and managed to prove that stack growth was the cause by forking the Go compiler and adding additional instrumentation (read: print statements).
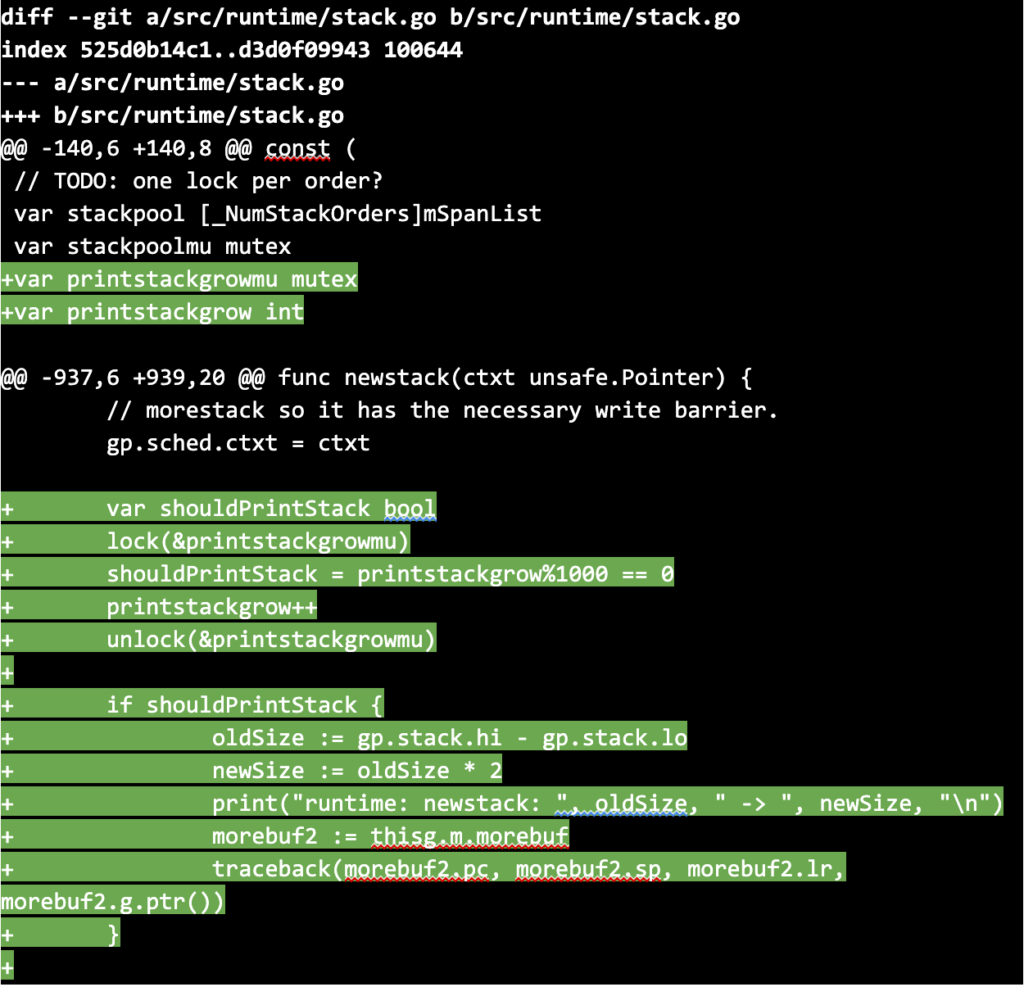
We decided to do the same, but since we were planning on using the forked compiler to build a production service, we introduced sampling of the print statements to prevent excessive logging from slowing the service down too much. Specifically, we modified the newstack function, which is called every time a goroutine needs to grow its stack, such that every thousandth time it was called, it would print a stack trace so we could see which code paths were triggering stack growth.
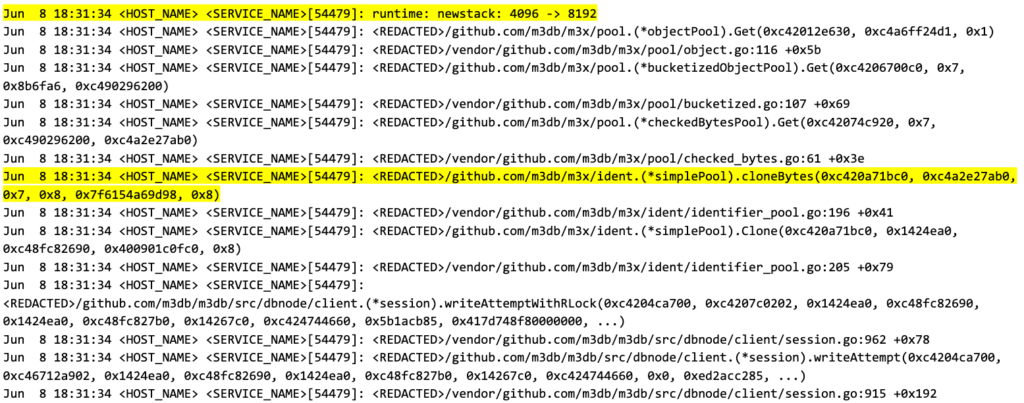
Next, we compiled our service using the forked Go compiler and a commit that still had the performance regression. We shipped it to production and almost immediately began seeing logs which demonstrated that goroutine stack growth was occurring around the problematic code:
We now had evidence that stack growth tended to occur around the problematic code, and in this case, it looked like the goroutine stack was growing from 4 kibibytes to 8 kibibytes, which is a huge allocation to perform on a per-request basis. But that still wasn’t enough. We needed to know how often it occurred, and whether the code that introduced the regression was more likely to trigger a stack growth.
We built our service with the forked compiler again, this time with three different commits, and measured how many times a stack growth similar to the one above took place over the course of two minutes:
| Commit | Sampled Average Number of Occurrences |
| With regression | 15,685 |
| With regression fix | 3,465 |
| With new worker pool | 171 |
With these measurements in hand, we felt much more confident that we had thoroughly root caused the issue and that our new worker pool would prevent rogue issues like this from cropping up again in the future. More importantly, we could finally sleep at night now that we truly understood the issue.
Key takeaways
The entire investigation of an end-to-end latency ingestion regression in M3 took two engineers approximately one week, from detecting the regression, root causing it, and shipping the fix to production. We learned a few important lessons:
- A methodical approach is often required when trying to isolate difficult issues. We were able to narrow the issue down to a few lines of code three levels of dependencies deep because we were methodical with our git bisect.
- Root causing an issue as far as possible leads to greater understanding, and in our case, better performance. We could have rolled back the change and called it a day, but in this case, going further enabled us to reduce our end-to-end ingestion latency by half–before the regression. This means that moving forward we’ll need only half as much hardware to maintain the same SLAs.
- A deep understanding of your programming language internals is important for making performance optimizations, especially when profiling tools falls short (which is more often than you think).
- In Go, pooling objects is important, but so is pooling goroutines.
Finally, I was lucky enough that a member of the Google Go engineering team watched me give a talk about this issue at Uber’s NYC Go meetup, asked me to file an issue about it on the Go GitHub repository, and then improved the runtime profiling such that time spent in runtime.morestack is now properly attributed to the function call that triggered the stack growth so that other engineers will have a much easier time diagnosing this issue in the future. We’re really grateful to the Go team and their commitment to aggressively tackling and solving issues that affect production systems.
If you have any questions or just want to discuss Uber’s M3 metrics stack, join the M3DB Gitter channel.
Be sure to visit Uber’s official open source page for more information about M3 and other projects.
If you’re interested in tackling infrastructure challenges at scale, consider applying for a role on our team.
Comments

