

前言
本文以Kaggle比赛Titanic入手,介绍了特征工程的几个方法,最后训练了三个模型(RF,GBDT,SVM)并使用了一个集成方法(Voting Classifier)进行预测。
完整代码及数据可以在ReMachineLearning(titanic) - Github中获取
正文
下面是kaggle对于这个比赛的介绍。
The sinking of the RMS Titanic is one of the most infamous shipwrecks in history. On April 15, 1912, during her maiden voyage, the Titanic sank after colliding with an iceberg, killing 1502 out of 2224 passengers and crew. This sensational tragedy shocked the international community and led to better safety regulations for ships.
One of the reasons that the shipwreck led to such loss of life was that there were not enough lifeboats for the passengers and crew. Although there was some element of luck involved in surviving the sinking, some groups of people were more likely to survive than others, such as women, children, and the upper-class.
In this challenge, we ask you to complete the analysis of what sorts of people were likely to survive. In particular, we ask you to apply the tools of machine learning to predict which passengers survived the tragedy.
简单来说就是已知乘客的各种信息,去推断这名乘客是否会幸存的一个二分类问题。
本文首先使用特征工程的一些方法,然后使用随机森林(Random Forests),GBDT(Gradient Boosting Decision Tree)和SVM(Support Vector Machine)作为训练模型,最后用了投票分类器(Voting Classifier)集成方法做了模型的集成。
本文基于Python 3、sklearn以及Pandas(强烈建议按照Anaconda),数据源于Kaggle,代码以及数据都可以在Github上获取
数据结构
先简单介绍下给的训练数据的csv结构
PassengerId,Survived,Pclass,Name,Sex,Age,SibSp,Parch,Ticket,Fare,Cabin,Embarked
1,0,3,"Braund, Mr. Owen Harris",male,22,1,0,A/5 21171,7.25,,S
2,1,1,"Cumings, Mrs. John Bradley (Florence Briggs Thayer)",female,38,1,0,PC 17599,71.2833,C85,C
3,1,3,"Heikkinen, Miss. Laina",female,26,0,0,STON/O2. 3101282,7.925,,S
4,1,1,"Futrelle, Mrs. Jacques Heath (Lily May Peel)",female,35,1,0,113803,53.1,C123,S
- PassengerID(ID)
- Survived(存活与否)
- Pclass(客舱等级)
- Name(名字)
- Sex(性别)
- Age(年龄)
- Parch(子女父母关系人数)
- SibSp(兄弟姐妹关系人数)
- Ticket(票编号)
- Fare(票价)
- Cabin(客舱编号)
- Embarked(上船的港口编号)
数据预处理
Sex
从数据里面可以看到数据中性别(Sex)是一个枚举字符串male或female,为了让计算机更好的处理这列数据,我们将其数值化处理
# API文档 https://pandas.pydata.org/pandas-docs/stable/generated/pandas.Series.map.html
# map方法数字化处理并改变pandas的列类型
df['Sex'] = df['Sex'].map({'female': 1, 'male': 0}).astype(int)
数据补全
用df.info()可以简单的发现哪类数据是不全的
<class 'pandas.core.frame.DataFrame'>
RangeIndex: 891 entries, 0 to 890
Data columns (total 12 columns):
PassengerId    891 non-null int64
Survived       891 non-null int64
Pclass         891 non-null int64
Name           891 non-null object
Sex            891 non-null int64
Age            714 non-null float64
SibSp          891 non-null int64
Parch          891 non-null int64
Ticket         891 non-null object
Fare           891 non-null float64
Cabin          204 non-null object
Embarked       889 non-null object
dtypes: float64(2), int64(6), object(4)
memory usage: 83.6+ KB
可以发现Age、Cabin,Embarked信息是不全的,这时候我们需要对这些进行补全。对于机器学习如何处理缺失数据的理论学习可以参考链接中的内容。
在这里例子里面我的解决方法是:
- Age的缺失值使用中位数补全。其实另一个合理的方法是建立一个模型来利用数据来“预测”缺失的数据。比如Age其实和Fare以及Pclass等有一定的联系(我这种萌新一般都是经ji舱)。
Parch 与 Sibsp
Sibsp指的是一同乘船的兄弟姐妹或配偶,Parch指的是一同乘船的父母或儿女。
添加familysize列作为sibsp和parch的和,代表总的家庭成员数。 这种从原始数据中挖掘隐藏属性或属性组合的方法叫做派生属性。但是这些挖掘出来的特征有几个问题:
- 这些特征间具有多重共线性,可能会导致空间的不稳定;
- 高维空间本身具有稀疏性,一维正态分布有68%的值落于正负标准差之间,而在十维空间上只有0.02%;
- 过多的属性会加大计算量。所以要用到数据归约技术(降维),归约后的数据集小得多,但基本保持原始数据的完整性。
其实这里我有些没有理解为什么要把Sibsp和Parch相加为Familysize,我没法解释这样做的合理性。
Fare
Fare指的是票价
数据探索分析
拿到数据后我们首先要做的是分析数据及特征。
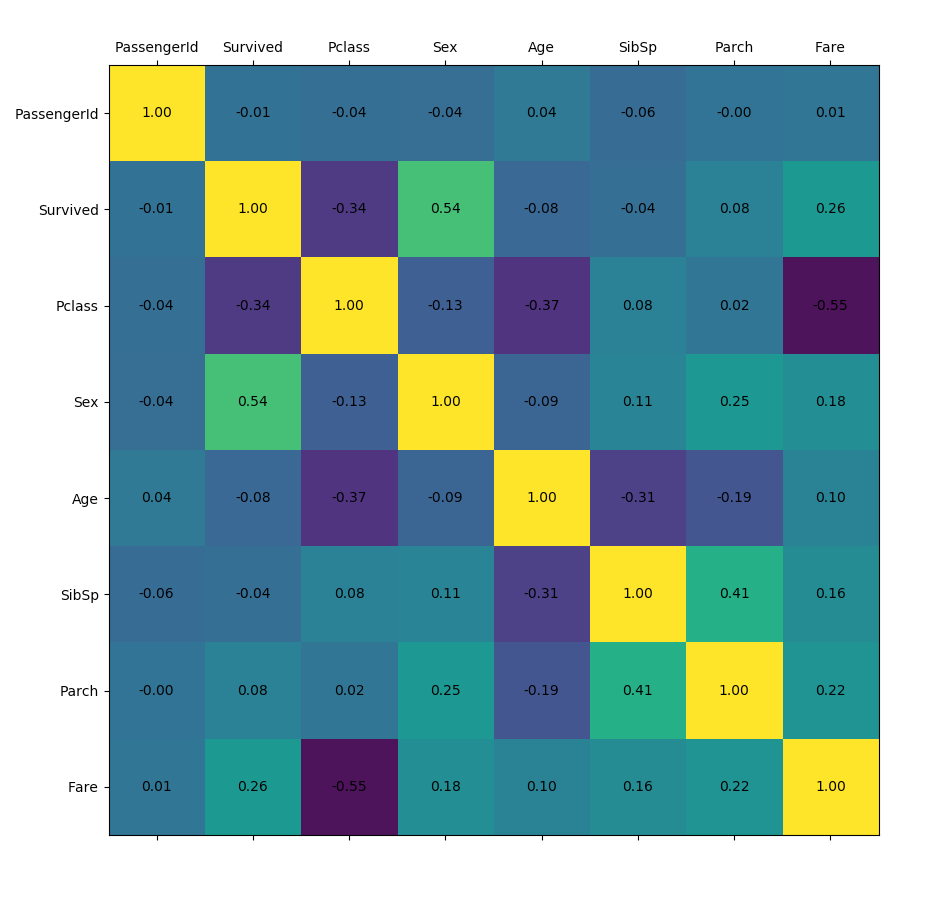
特征相关性分析(feature correlations)
pandas可以通过DataFrame的corr方法计算数据的相关系数(方法包括三种:pearson,kendall,spearman),这里也不扩展,反正能够计算出数据之间的相关性。
# API文档 https://pandas.pydata.org/pandas-docs/stable/generated/pandas.DataFrame.corr.html
def plot_corr(df,size=10):
    '''Function plots a graphical correlation matrix for each pair of columns in the dataframe.

    Input:
        df: pandas DataFrame
        size: vertical and horizontal size of the plot'''

    corr = df.corr()
    fig, ax = plt.subplots(figsize=(size, size))
    ax.matshow(corr)
    for (i, j), z in np.ndenumerate(corr):
        ax.text(j, i, '{:.2f}'.format(z), ha='center', va='center')
    plt.xticks(range(len(corr.columns)), corr.columns)
    plt.yticks(range(len(corr.columns)), corr.columns)

# 特征相关性图表
plot_corr(df)
模型
之前也说到了我们会用到三个模型以及一个集成方法,这块没有什么好细说的。
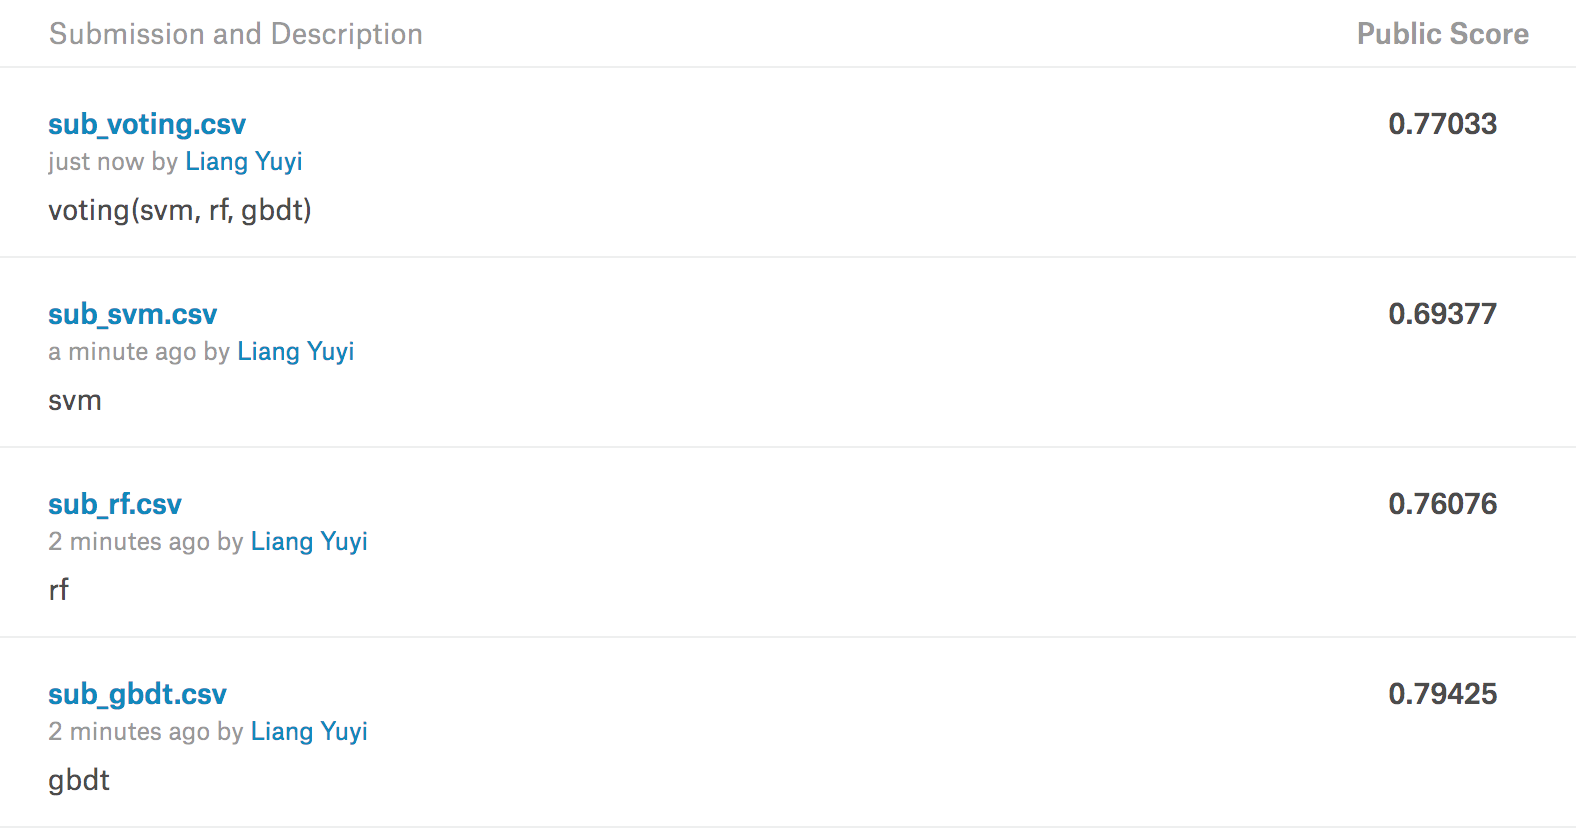
使用了随机森林(Random Forests),GBDT(Gradient Boosting Decision Tree)和SVM(Support Vector Machine)作为训练模型,最后用了投票分类器(Voting Classifier)集成方法做了模型的集成
结果
使用Voting以及单个模型的得分如下:
后记
这篇博文里面涉及的算法每一个我后期都会单独写一篇博文(坑我先挖了),这篇博客从开始写到现在差不多2个月了=,=,中间断了一次现在才写完。
