

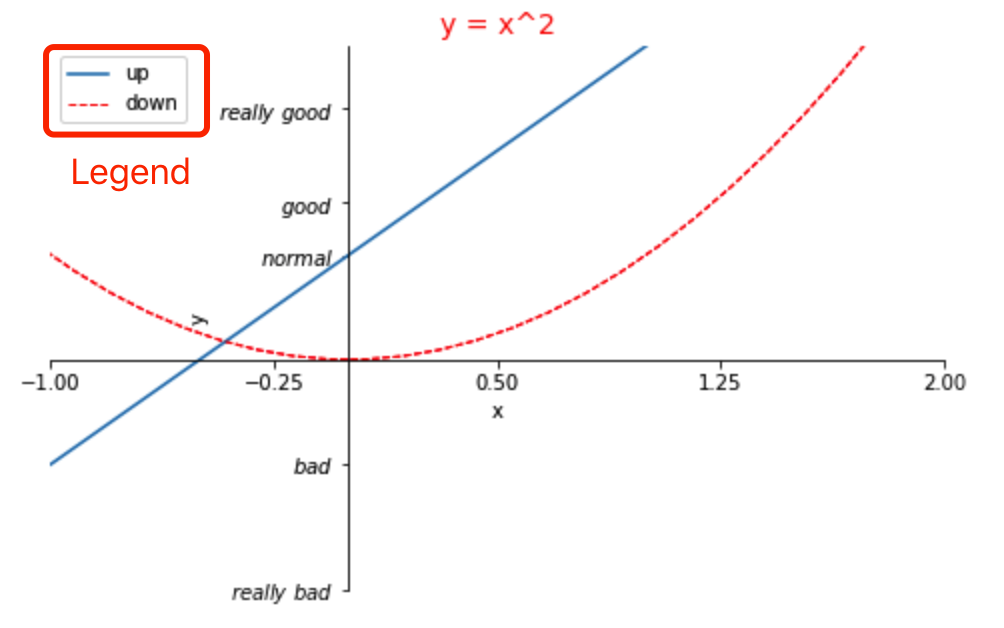
Matplotlib 的 Legend 图例就是为了帮助我们展示每个数据对应的图像名称,更好的让读者认识到你的数据结构。
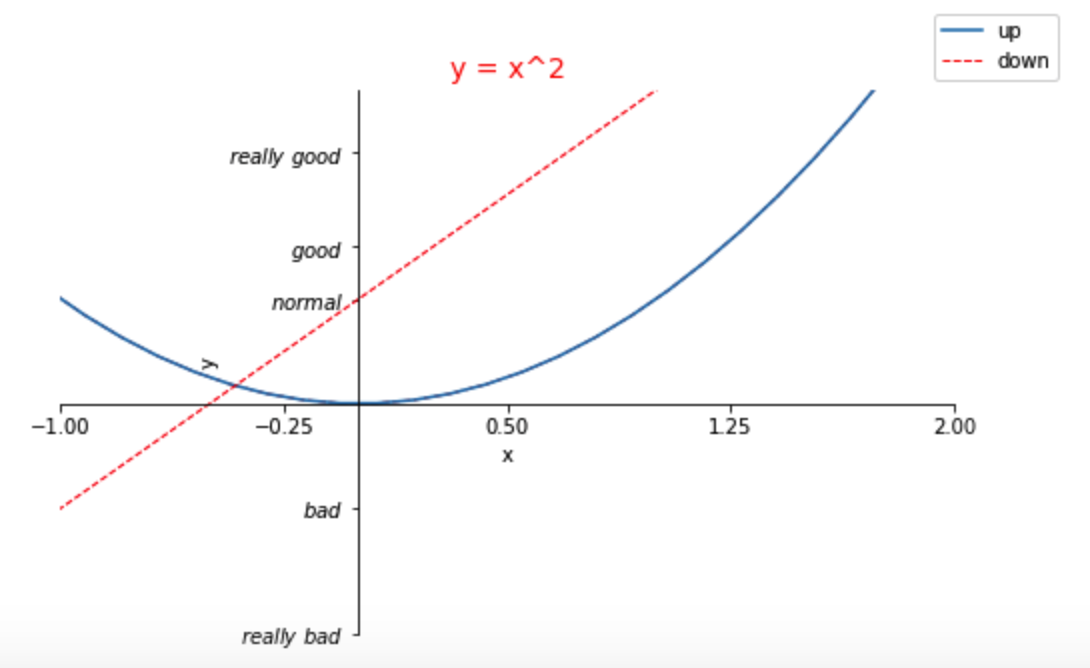
如图,红色标注部分就是 Legend 图例。
在之前的一篇文章 Matplotlib 系列之「绘制函数图像」 中已经细讲过 Matplotlib 的绘制过程以及结构分析,希望读者能先去了解一下。
接着上一次的代码继续讲解 Legend 图例如何展示,以及有哪些常用的特性。
import matplotlib.pyplot as plt
import numpy as np
x=np.linspace(-3,3,50)
y1=2*x+1
y2=x**2

plt.figure(num=3,figsize=(8,5))
l1=plt.plot(x,y2)
l2=plt.plot(x,y1,color='red',linewidth=1.0,linestyle='--')

plt.legend(handles=[l1,l2],labels=['up','down'],loc='best')

plt.xlabel('x')
plt.ylabel('y')

plt.xlim((-1,2))
plt.ylim((-2,3))

new_ticks=np.linspace(-1,2,5)
print(new_ticks)
plt.xticks(new_ticks)
plt.yticks([-2,-1.8,-1,1.22,3],
          [r'$really\ bad$',r'$bad$',r'$normal$',r'$good$',r'$really\ good$'])

ax=plt.gca()
ax.spines['right'].set_color('none')
ax.spines['top'].set_color('none')

ax.xaxis.set_ticks_position('bottom')
ax.yaxis.set_ticks_position('left')
ax.spines['bottom'].set_position(('data',0))
ax.spines['left'].set_position(('data',0))

plt.show()
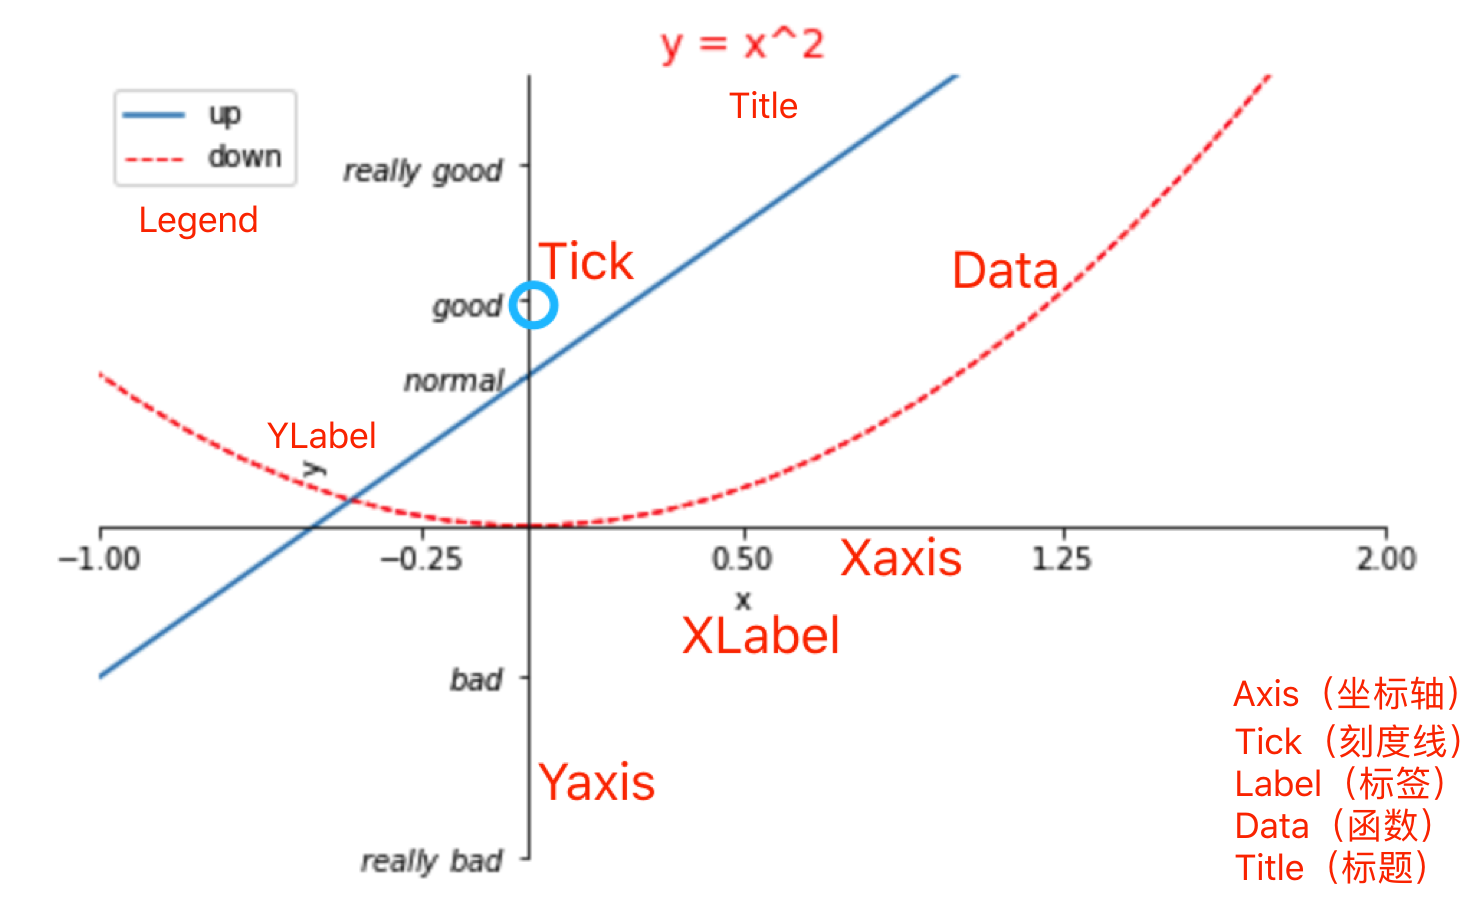
上一节中仔细绘制了 Matplotlib 的图像结构,现在可以进行回顾一下。
Title 为图像标题,Axis 为坐标轴, Label 为坐标轴标注,Tick 为刻度线,Tick Label 为刻度注释,Legend 为图例。
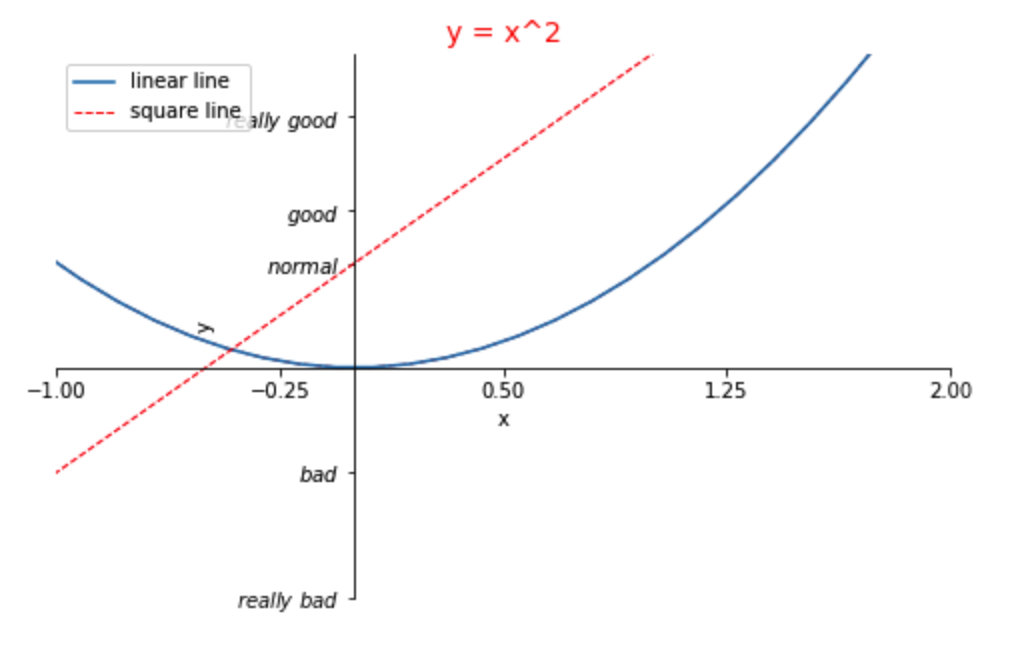
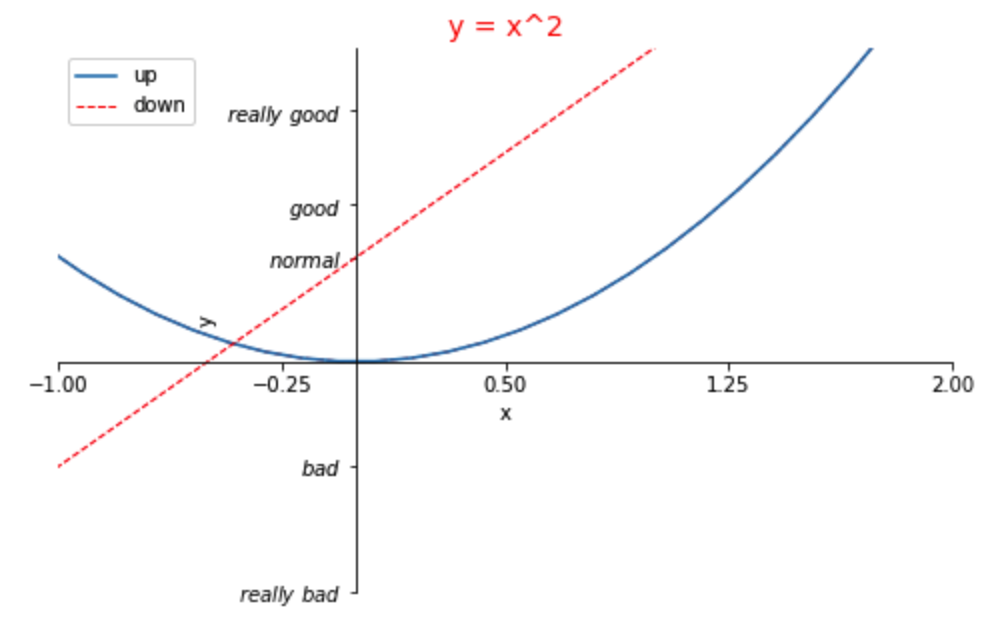
设置 Legend 图例
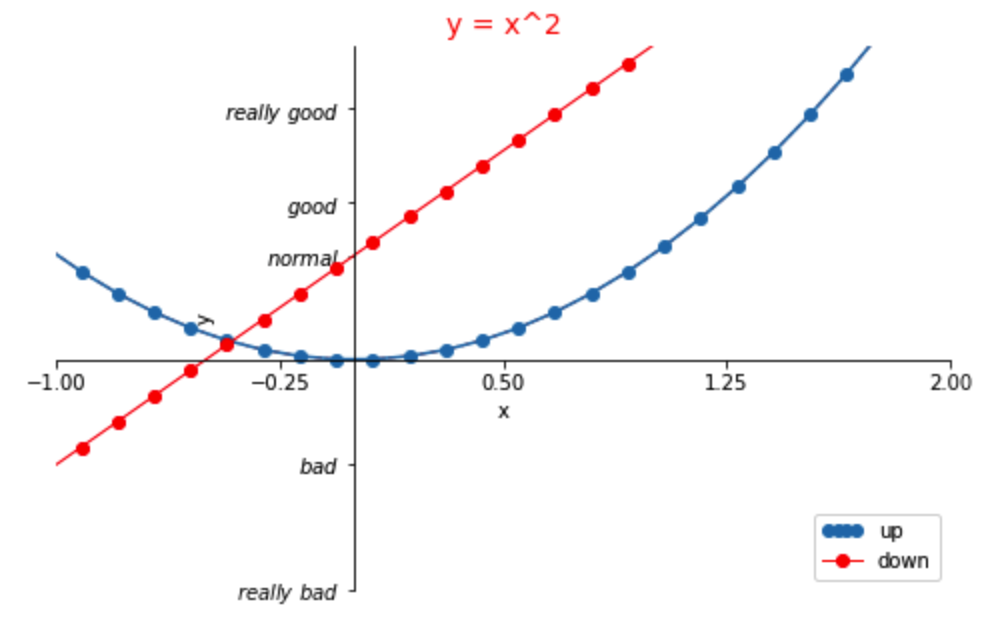
这里我们将 Legend 图例设置成 如上图中所示,即 up 对应 y = 2x + 1,是一条实线,默认颜色,down 对应 y = x^2^ ,虚线,红色,最后调用 legend 方法设置一些样式即可。
# 设置 legend 图例
l1,=plt.plot(x,y1,label='linear line')
l2,=plt.plot(x,y2,color='red',linewidth=1.0,linestyle='--',label='square line')

plt.legend()
不带参数调用 legend 会自动获取图例句柄及相关标签,此函数等同于:
handles, labels = ax.get_legend_handles_labels()
ax.legend(handles, labels)
为完全控制要添加的图例句柄,通常将适当的句柄直接传递给 legend:
plt.legend(handles=[l1, l2])
在某些情况下,我们需要为 legend 图例设置标签
plt.legend(handles=[l1, l2], labels=['up', 'down'])
图例的位置
图例的位置可以通过关键字参数loc指定。 bbox_to_anchor关键字可让用户手动控制图例布局。 例如,如果你希望轴域图例位于图像的右上角而不是轴域的边角,则只需指定角的位置以及该位置的坐标系:
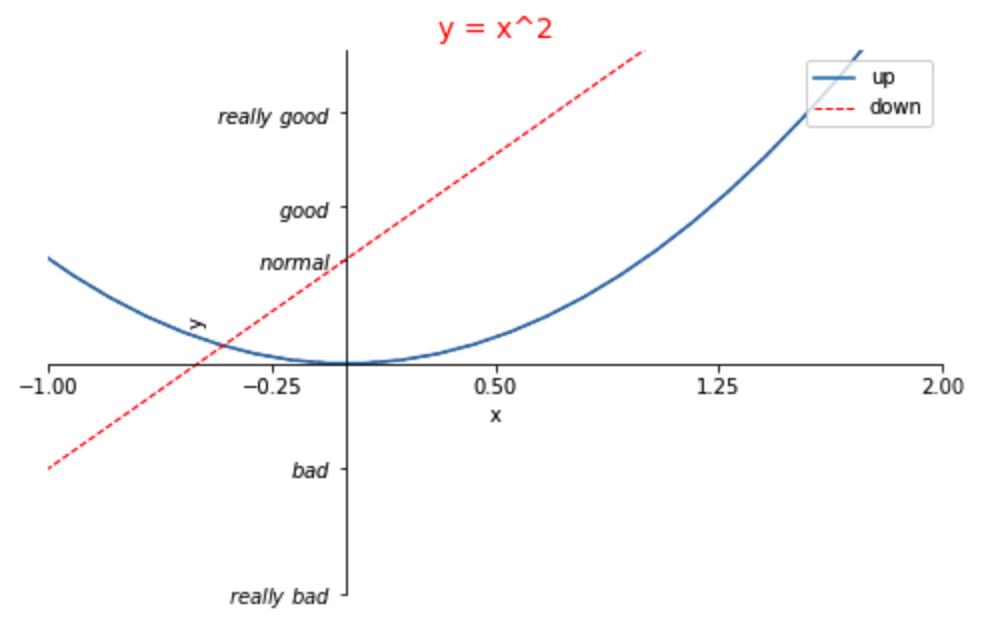
当我们指定 loc = 'upper right',legend 图例将在右上角展示:
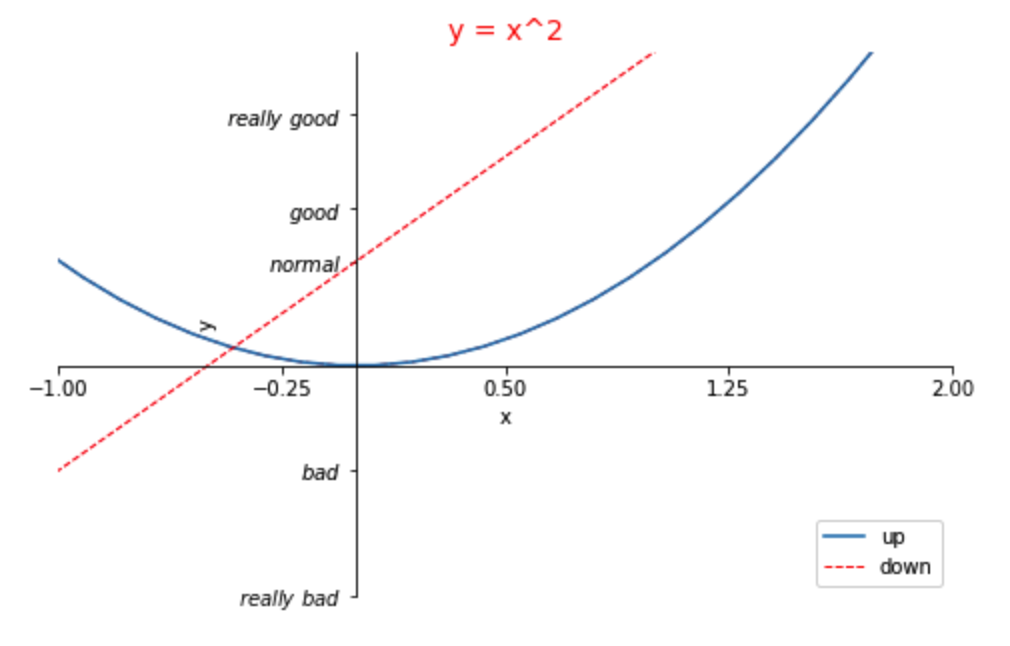
你还可以指定 loc 在任何你想要指定的位置:
plt.legend(handles=[l1, l2], labels=['up', 'down'], loc='lower right')
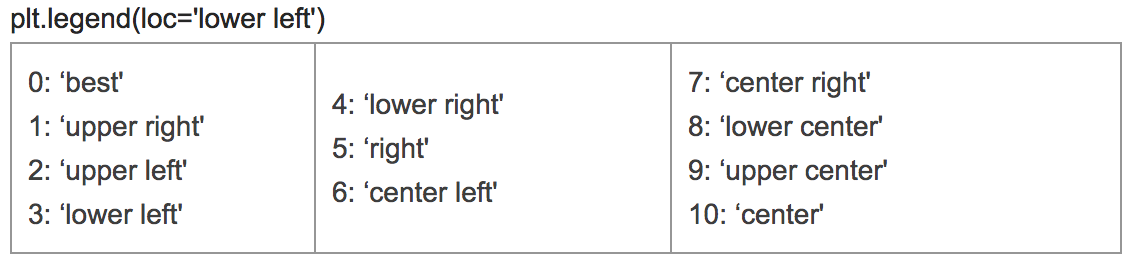
loc 使用参数
整数,字符串或浮点偶对,默认为 'upper right'。
Legend 常见参数速查表
| Keyword | Description |
|---|---|
| loc | Location code string, or tuple (see below) |
| fontsize | the font size (used only if prop is not specified) |
| prop | the font property |
| markerscale | the relative size of legend markers vs. original |
| markerfirst | If True (default), marker is to left of the label |
| numpoints | the number of points in the legend for line |
| scatterpoints | he number of points in the legend for scatter plot |
| scatteroffsets | a list of yoffsets for scatter symbols in legend |
| frameon | If True, draw the legend on a patch (frame) |
| shadow | If True, draw a shadow behind legend |
| framealpha | Transparency of the frame |
| edgecolor | Frame edgecolor |
| facecolor | Frame facecolor |
| fancybox | If True, draw the frame with a round fancybox |
| ncol | number of columns |
| borderpad | the fractional whitespace inside the legend border |
| handlelength | the length of the legend hendles |
| handletextpad | The pad between the legend handle and text |
| borderaxespad | the pad between the axes and legend border |
| columnspacing | the spacing between columns |
| title | the legend title |
| bbox_to_anchor | the bbox that the legend will be anchored |
| bbox_tansform | the transform for the bbox,transAxes if None |
图例处理器
为了创建图例条目,将句柄作为参数提供给适当的HandlerBase子类。 处理器子类的选择
有以下规则确定:
- 使用
handler_map关键字中的值更新get_legend_handler_map()。 - 检查句柄是否在新创建的
handler_map中。 - 检查句柄的类型是否在新创建的
handler_map中。 - 检查句柄的
mro中的任何类型是否在新创建的handler_map中。
处于完整性,这个逻辑大多在get_legend_handler()中实现。
为了简单起见,让我们选择matplotlib.legend_handler.HandlerLine2D,它接受numpoints参数(出于便利,注意numpoints是legend()函数上的一个关键字)。 然后我们可以将实例的字典作为关键字handler_map传给legend。
import matplotlib.pyplot as plt
from matplotlib.legend_handler import HandlerLine2D

# 设置legend图例
l1,=plt.plot(x,y1,marker = 'o',label='linear line')
l2,=plt.plot(x,y2,color='red',linewidth=1.0,marker = 'o',label='square line')

plt.legend(handler_map = {l1:HandlerLine2D(numpoints=4)},handles=[l1, l2], labels=['up', 'down'],  loc='lower right')
如你所见,up现在有 4 个标记点,down有两个(默认值)。
