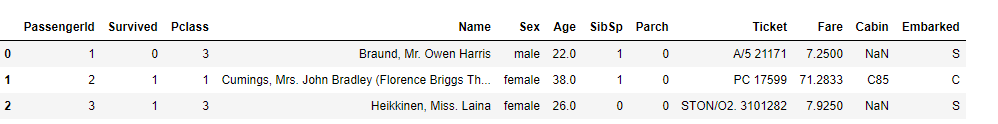
  print (titanic["Sex"].unique())

  # Replace all the occurences of male with the number 0.
  titanic.loc[titanic["Sex"] == "male", "Sex"] = 0
  titanic.loc[titanic["Sex"] == "female", "Sex"] = 1
  # Import the linear regression class
  from sklearn.linear_model import LinearRegression
  # Sklearn also has a helper that makes it easy to do cross validation
  from sklearn.model_selection import KFold

  # The columns we'll use to predict the target
  predictors = ["Pclass", "Sex", "Age", "SibSp", "Parch", "Fare", "Embarked"]

  # Initialize our algorithm class
  alg = LinearRegression()
  # Generate cross validation folds for the titanic dataset.  It return the row indices corresponding to train and test.
  # We set random_state to ensure we get the same splits every time we run this.
  kf = KFold(n_splits=3, random_state=1, shuffle=False)

  predictions = []
  for train, test in kf.split(titanic):
      # The predictors we're using the train the algorithm.  Note how we only take the rows in the train folds.
      train_predictors = (titanic[predictors].iloc[train,:])
      # The target we're using to train the algorithm.
      train_target = titanic["Survived"].iloc[train]
      # Training the algorithm using the predictors and target.
      alg.fit(train_predictors, train_target)
      # We can now make predictions on the test fold
      test_predictions = alg.predict(titanic[predictors].iloc[test,:])
      predictions.append(test_predictions)

      import numpy as np

  # The predictions are in three separate numpy arrays.  Concatenate them into one.
  # We concatenate them on axis 0, as they only have one axis.
  predictions = np.concatenate(predictions, axis=0)

  # Map predictions to outcomes (only possible outcomes are 1 and 0)
  predictions[predictions > .5] = 1
  predictions[predictions <=.5] = 0
  accuracy = sum(predictions[predictions == titanic["Survived"]]) / len(predictions)
  print (accuracy)

  0.2615039281705948
  from sklearn.model_selection import cross_val_score
  from sklearn.linear_model import LogisticRegression
  # Initialize our algorithm
  alg = LogisticRegression(random_state=1)
  # Compute the accuracy score for all the cross validation folds.  (much simpler than what we did before!)
  scores = cross_val_score(alg, titanic[predictors], titanic["Survived"], cv=3)
  # Take the mean of the scores (because we have one for each fold)
  print(scores.mean())

  0.7878787878787877
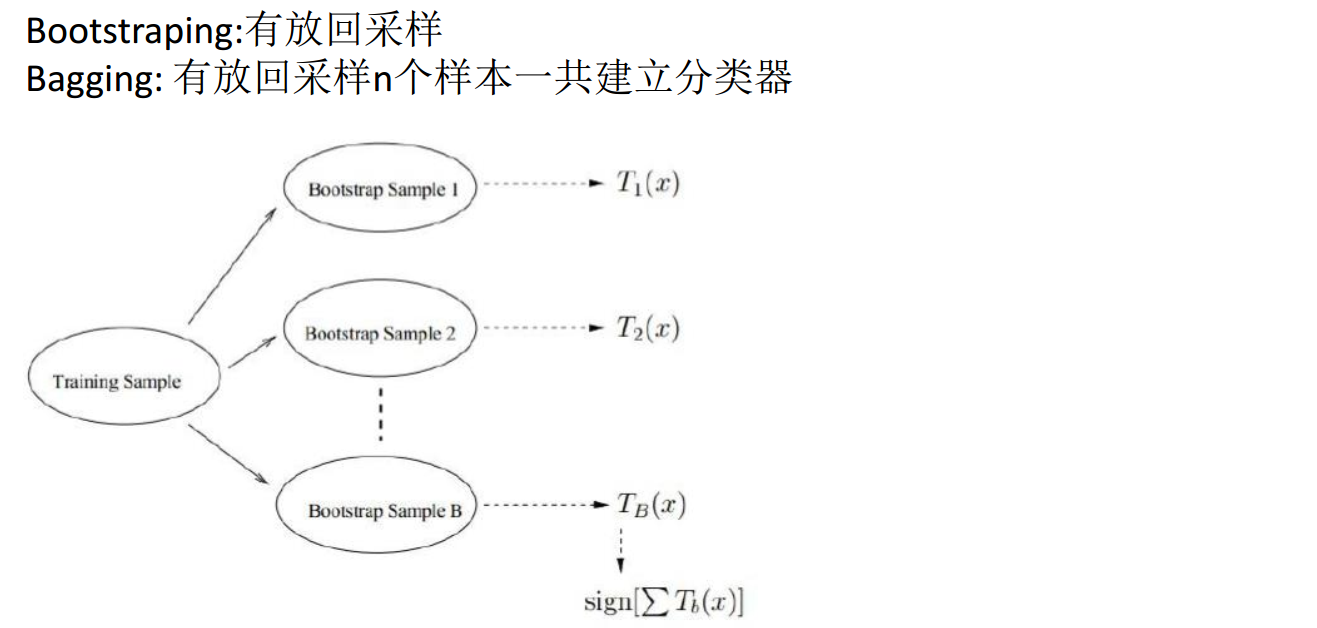
随机森林测试
  import pandas #ipython notebook
  import numpy as np
  from sklearn.model_selection import KFold
  from sklearn.model_selection import train_test_split
  from sklearn.model_selection import cross_val_score
  from sklearn.ensemble import RandomForestClassifier

  titanic_test = pandas.read_csv("C:\\ML\\MLData\\titanic_train.csv")
  titanic_test["Age"] = titanic_test["Age"].fillna(titanic_test["Age"].median())
  titanic_test["Fare"] = titanic_test["Fare"].fillna(titanic_test["Fare"].median())
  titanic_test.loc[titanic_test["Sex"] == "male", "Sex"] = 0
  titanic_test.loc[titanic_test["Sex"] == "female", "Sex"] = 1
  titanic_test["Embarked"] = titanic_test["Embarked"].fillna("S")

  titanic_test.loc[titanic_test["Embarked"] == "S", "Embarked"] = 0
  titanic_test.loc[titanic_test["Embarked"] == "C", "Embarked"] = 1
  titanic_test.loc[titanic_test["Embarked"] == "Q", "Embarked"] = 2


  predictors = ["Pclass", "Sex", "Age", "SibSp", "Parch", "Fare", "Embarked"]

  # Initialize our algorithm with the default paramters
  # n_estimators is the number of trees we want to make
  # min_samples_split is the minimum number of rows we need to make a split
  # min_samples_leaf is the minimum number of samples we can have at the place where a tree branch ends (the bottom points of the tree)
  alg = RandomForestClassifier(random_state=1, n_estimators=50, min_samples_split=2, min_samples_leaf=1)
  # Compute the accuracy score for all the cross validation folds.  (much simpler than what we did before!)
  kf = KFold(n_splits=3, random_state=1, shuffle=False)
  scores = cross_val_score(alg, titanic_test[predictors], titanic_test["Survived"], cv=kf)


  0.7901234567901234
数据预处理
  # Take the mean of the scores (because we have one for each fold)
  print(scores.mean())

  # Generating a familysize column
  titanic_test["FamilySize"] = titanic_test["SibSp"] + titanic_test["Parch"]

  # The .apply method generates a new series
  titanic_test["NameLength"] = titanic_test["Name"].apply(lambda x: len(x))

  import re

  # A function to get the title from a name.
  def get_title(name):
      # Use a regular expression to search for a title.  Titles always consist of capital and lowercase letters, and end with a period.
      title_search = re.search(' ([A-Za-z]+)\.', name)
      # If the title exists, extract and return it.
      if title_search:
          return title_search.group(1)
      return ""

  # Get all the titles and print how often each one occurs.
  titles = titanic_test["Name"].apply(get_title)
  print(pandas.value_counts(titles))

  # Map each title to an integer.  Some titles are very rare, and are compressed into the same codes as other titles.
  title_mapping = {"Mr": 1, "Miss": 2, "Mrs": 3, "Master": 4, "Dr": 5, "Rev": 6, "Major": 7, "Col": 7, "Mlle": 8, "Mme": 8, "Don": 9, "Lady": 10, "Countess": 10, "Jonkheer": 10, "Sir": 9, "Capt": 7, "Ms": 2}
  for k,v in title_mapping.items():
      titles[titles == k] = v

  # Verify that we converted everything.
  print(pandas.value_counts(titles))

  # Add in the title column.
  titanic_test["Title"] = titles

  Mr          517
  Miss        182
  Mrs         125
  Master       40
  Dr            7
  Rev           6
  Major         2
  Col           2
  Mlle          2
  Don           1
  Capt          1
  Ms            1
  Jonkheer      1
  Countess      1
  Sir           1
  Mme           1
  Lady          1
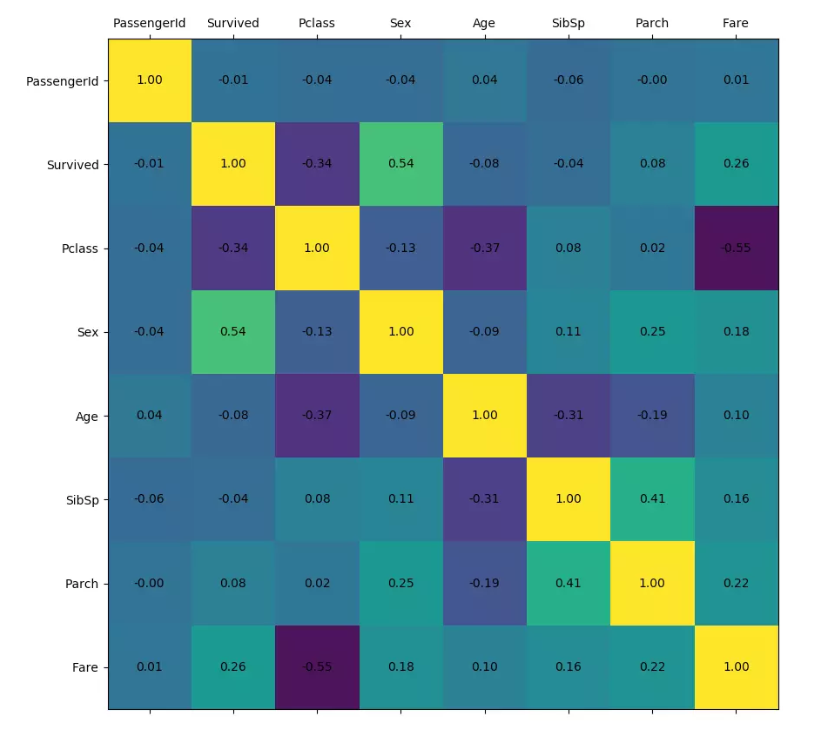
    def plot_corr(df,size=10):
        '''Function plots a graphical correlation matrix for each pair of columns in the dataframe.

        Input:
            df: pandas DataFrame
            size: vertical and horizontal size of the plot'''

        corr = df.corr()
        fig, ax = plt.subplots(figsize=(size, size))
        ax.matshow(corr)
        for (i, j), z in np.ndenumerate(corr):
            ax.text(j, i, '{:.2f}'.format(z), ha='center', va='center')
        plt.xticks(range(len(corr.columns)), corr.columns)
        plt.yticks(range(len(corr.columns)), corr.columns)

    # 特征相关性图表
    plot_corr(df)
多特征随机森林测试(增加训练特征)
import numpy as np
from sklearn.feature_selection import SelectKBest, f_classif
import matplotlib.pyplot as plt
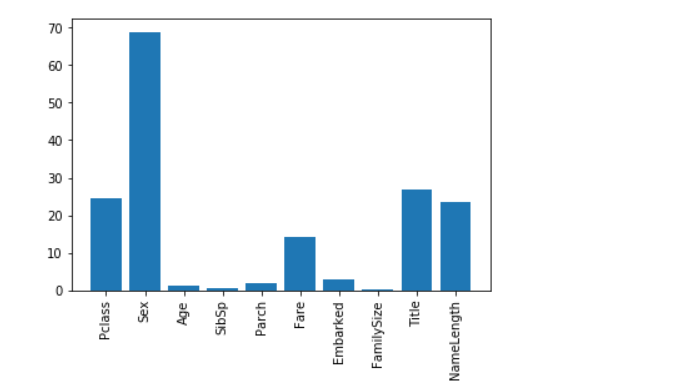
predictors = ["Pclass", "Sex", "Age", "SibSp", "Parch", "Fare", "Embarked", "FamilySize", "Title", "NameLength"]
# Perform feature selection
selector = SelectKBest(f_classif, k=5)
selector.fit(titanic_test[predictors], titanic_test["Survived"])
# Get the raw p-values for each feature, and transform from p-values into scores
scores = -np.log10(selector.pvalues_)
# Plot the scores. See how "Pclass", "Sex", "Title", and "Fare" are the best?
plt.bar(range(len(predictors)), scores)
plt.xticks(range(len(predictors)), predictors, rotation='vertical')
plt.show()
# Pick only the four best features.
predictors = ["Pclass", "Sex", "Fare", "Title"]
# Initialize our algorithm with the default paramters
# n_estimators is the number of trees we want to make
# min_samples_split is the minimum number of rows we need to make a split
# min_samples_leaf is the minimum number of samples we can have at the place where a tree branch ends (the bottom points of the tree)
alg = RandomForestClassifier(random_state=1, n_estimators=50, min_samples_split=2, min_samples_leaf=1)
# Compute the accuracy score for all the cross validation folds. (much simpler than what we did before!)
kf = KFold(n_splits=3, random_state=1, shuffle=False)
scores = cross_val_score(alg, titanic_test[predictors], titanic_test["Survived"], cv=kf)
# Take the mean of the scores (because we have one for each fold)
print(scores.mean())
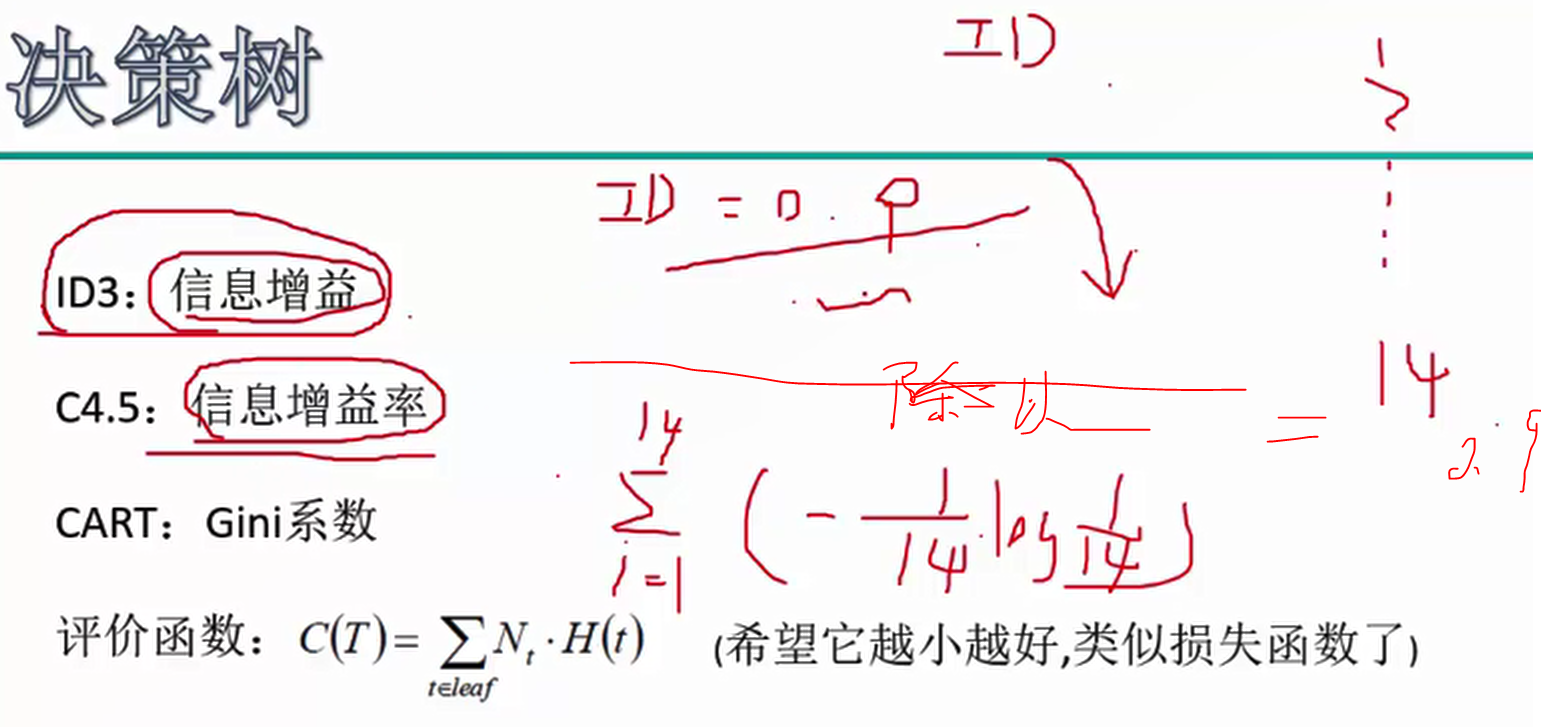
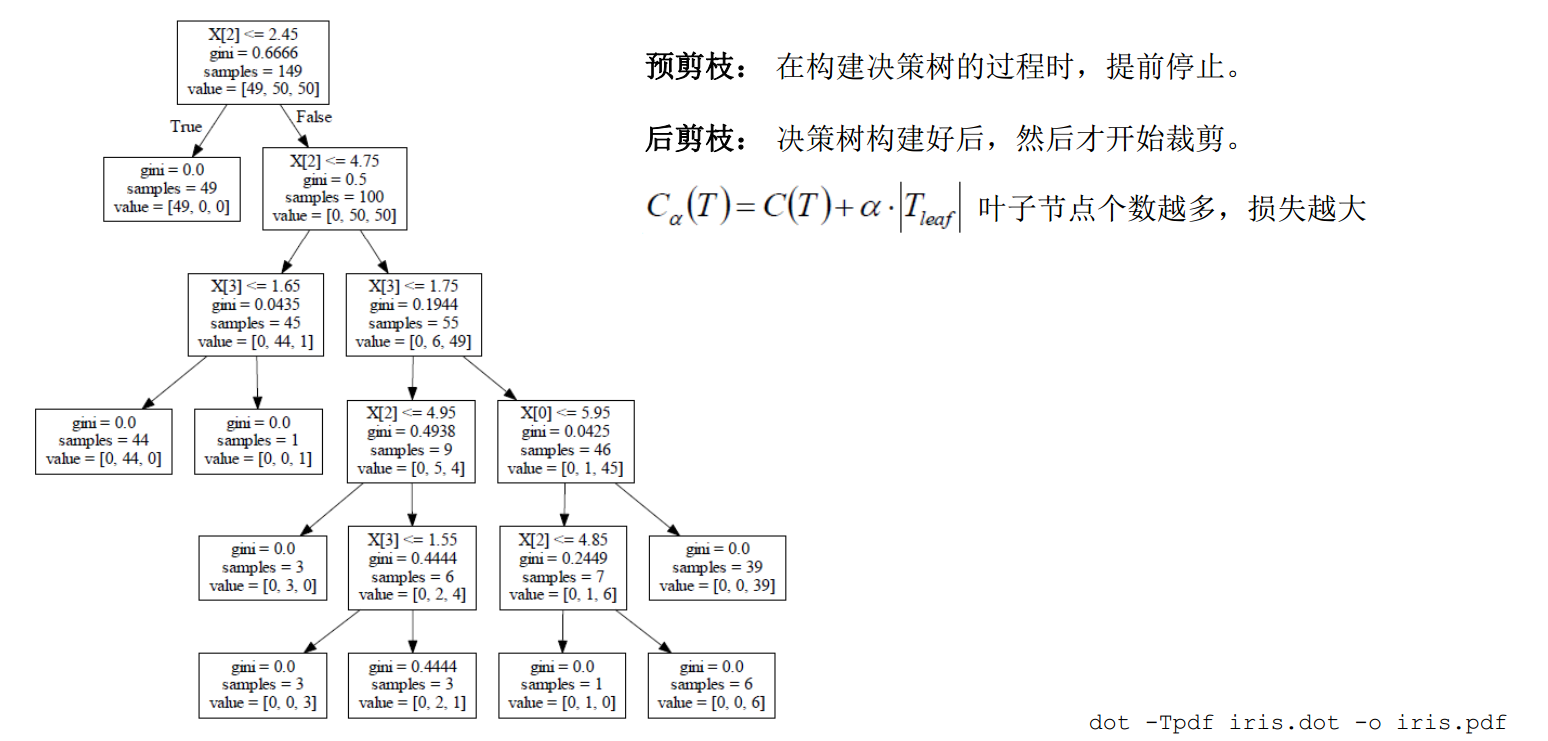
  from sklearn.tree import DecisionTreeClassifier
  #  1.criterion  gini  or  entropy(基于gini系数和熵值来指定)

  #  2.splitter  best or random 前者是在所有特征中找最好的切分点 后者是在部分特征中(数据量大的时候)

  #  3.max_features  None(所有) 特征小于50的时候一般使用所有的 ,log2,sqrt,N

  #  4.max_depth  数据少或者特征少的时候可以不管这个值,如果模型样本量多,特征也多的情况下,可以尝试限制下

  #  5.min_samples_split  如果某节点的样本数少于min_samples_split,则不会继续再尝试选择最优特征来进行划分
  #                       如果样本量不大,不需要管这个值。如果样本量数量级非常大,则推荐增大这个值。

  #  6.min_samples_leaf  这个值限制了叶子节点最少的样本数,如果某叶子节点数目小于样本数,则会和兄弟节点一起被
  #                      剪枝,如果样本量不大,不需要管这个值,大些如10W可是尝试下5

  #  7.min_weight_fraction_leaf 这个值限制了叶子节点所有样本权重和的最小值,如果小于这个值,则会和兄弟节点一起
  #                          被剪枝默认是0,就是不考虑权重问题。一般来说,如果我们有较多样本有缺失值,
  #                          或者分类树样本的分布类别偏差很大,就会引入样本权重,这时我们就要注意这个值了。

  #  8.max_leaf_nodes 通过限制最大叶子节点数,可以防止过拟合,默认是"None”,即不限制最大的叶子节点数。
  #                   如果加了限制,算法会建立在最大叶子节点数内最优的决策树。
  #                   如果特征不多,可以不考虑这个值,但是如果特征分成多的话,可以加以限制
  #                   具体的值可以通过交叉验证得到。

  #  9.class_weight 指定样本各类别的的权重,主要是为了防止训练集某些类别的样本过多
  #                 导致训练的决策树过于偏向这些类别。这里可以自己指定各个样本的权重
  #                 如果使用“balanced”,则算法会自己计算权重,样本量少的类别所对应的样本权重会高。

  #  10.min_impurity_split 这个值限制了决策树的增长,如果某节点的不纯度
  #                       (基尼系数,信息增益,均方差,绝对差)小于这个阈值
  #                       则该节点不再生成子节点。即为叶子节点 。

  decision_tree_classifier = DecisionTreeClassifier()

  # Train the classifier on the training set
  decision_tree_classifier.fit(training_inputs, training_classes)

  # Validate the classifier on the testing set using classification accuracy
  decision_tree_classifier.score(testing_inputs, testing_classes)
级联预测
  from sklearn.ensemble import GradientBoostingClassifier
  from sklearn.linear_model import LogisticRegression
  import numpy as np

  # The algorithms we want to ensemble.
  # We're using the more linear predictors for the logistic regression, and everything with the gradient boosting classifier.
  algorithms = [
      [GradientBoostingClassifier(random_state=1, n_estimators=50, max_depth=5), ["Pclass", "Sex", "Age", "Fare", "Embarked", "FamilySize", "Title",]],
      [LogisticRegression(random_state=1), ["Pclass", "Sex", "Fare", "FamilySize", "Title", "Age", "Embarked"]]
  ]

  # Initialize the cross validation folds
  kf = KFold(n_splits=3, random_state=1, shuffle=False)

  predictions = []
  for train, test in kf.split(titanic_test):
      train_target = titanic_test["Survived"].iloc[train]
      full_test_predictions = []
      # Make predictions for each algorithm on each fold
      for alg, predictors in algorithms:
          # Fit the algorithm on the training data.
          alg.fit(titanic_test[predictors].iloc[train,:], train_target)
          # Select and predict on the test fold.
          # The .astype(float) is necessary to convert the dataframe to all floats and avoid an sklearn error.
          test_predictions = alg.predict_proba(titanic_test[predictors].iloc[test,:].astype(float))[:,1]
          full_test_predictions.append(test_predictions)
      # Use a simple ensembling scheme -- just average the predictions to get the final classification.
      test_predictions = (full_test_predictions[0] + full_test_predictions[1]) / 2
      # Any value over .5 is assumed to be a 1 prediction, and below .5 is a 0 prediction.
      test_predictions[test_predictions <= .5] = 0
      test_predictions[test_predictions > .5] = 1
      predictions.append(test_predictions)

  # Put all the predictions together into one array.
  predictions = np.concatenate(predictions, axis=0)

  # Compute accuracy by comparing to the training data.
  accuracy = sum(predictions[predictions == titanic_test["Survived"]]) / len(predictions)
  print(accuracy)