数据的重要性我们大家都知道,就算再小的项目中都可能使用几个图表展示,我最近在做项目的过程中也是需要用到图表,最后选择了echarts 图表库,为什么选择 echarts,第一:简单上手容易,第二:它几乎可以满足我们所有的开发需要,第三:echarts 应该是国内做的最好的可视化库之一了。
废话不多说,那我们就看看如何在 Vue 的项目中使用 echarts。
第一种方法,直接引入echarts
安装echarts项目依赖
npm install echarts --save

//或者
npm install echarts -S
如果没有科学上网的朋友可以使用国内的淘宝镜像。
npm install -g cnpm --registry=https://registry.npm.taobao.org

cnpm install echarts -S
全局引入
我们安装完成之后,可以在 main.js 中全局引入 echarts
import echarts from "echarts";
Vue.prototype.$echarts = echarts;
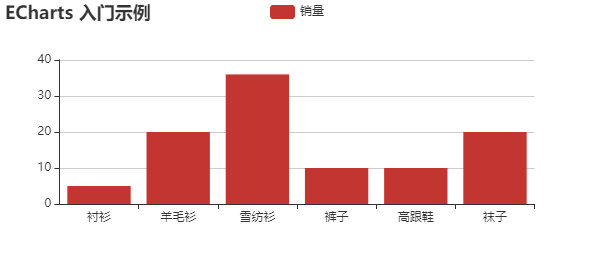
创建图表
<template>
  <div id="app">
    <div id="main" style="width: 600px;height:400px;"></div>
  </div>
</template>
export default {
  name: "app",
  methods: {
    drawChart() {
      // 基于准备好的dom,初始化echarts实例
      let myChart = this.$echarts.init(document.getElementById("main"));
      // 指定图表的配置项和数据
      let option = {
        title: {
          text: "ECharts 入门示例"
        },
        tooltip: {},
        legend: {
          data: ["销量"]
        },
        xAxis: {
          data: ["衬衫", "羊毛衫", "雪纺衫", "裤子", "高跟鞋", "袜子"]
        },
        yAxis: {},
        series: [
          {
            name: "销量",
            type: "bar",
            data: [5, 20, 36, 10, 10, 20]
          }
        ]
      };
      // 使用刚指定的配置项和数据显示图表。
      myChart.setOption(option);
    }
  },
  mounted() {
    this.drawChart();
  }
};
</script>
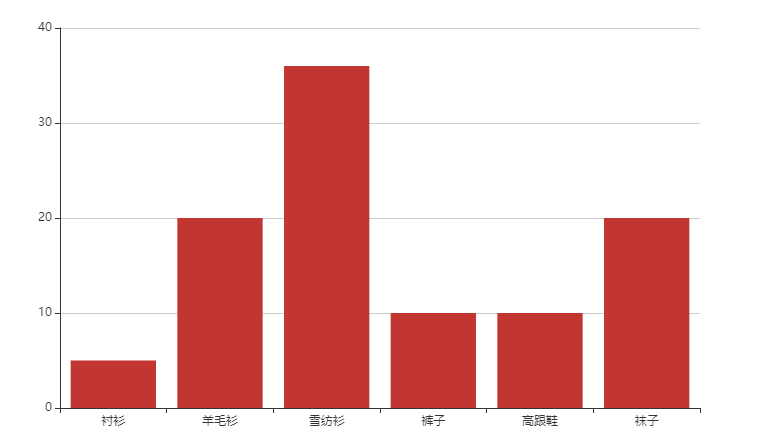
第二种方法,使用 Vue-ECharts 组件
安装组件
npm install vue-echarts -S
使用组件
<template>
  <div id="app">
    <v-chart class="my-chart" :options="bar"/>
  </div>
</template>
<script>
import ECharts from "vue-echarts/components/ECharts";
import "echarts/lib/chart/bar";
export default {
  name: "App",
  components: {
    "v-chart": ECharts
  },
  data: function() {
    return {
      bar: {
        title: {
          text: "ECharts 入门示例"
        },
        tooltip: {},
        legend: {
          data: ["销量"]
        },
        xAxis: {
          data: ["衬衫", "羊毛衫", "雪纺衫", "裤子", "高跟鞋", "袜子"]
        },
        yAxis: {},
        series: [
          {
            name: "销量",
            type: "bar",
            data: [5, 20, 36, 10, 10, 20]
          }
        ]
      }
    };
  }
};
</script>
<style>
.my-chart {
  width: 800px;
  height: 500px;
}
</style>