

背景
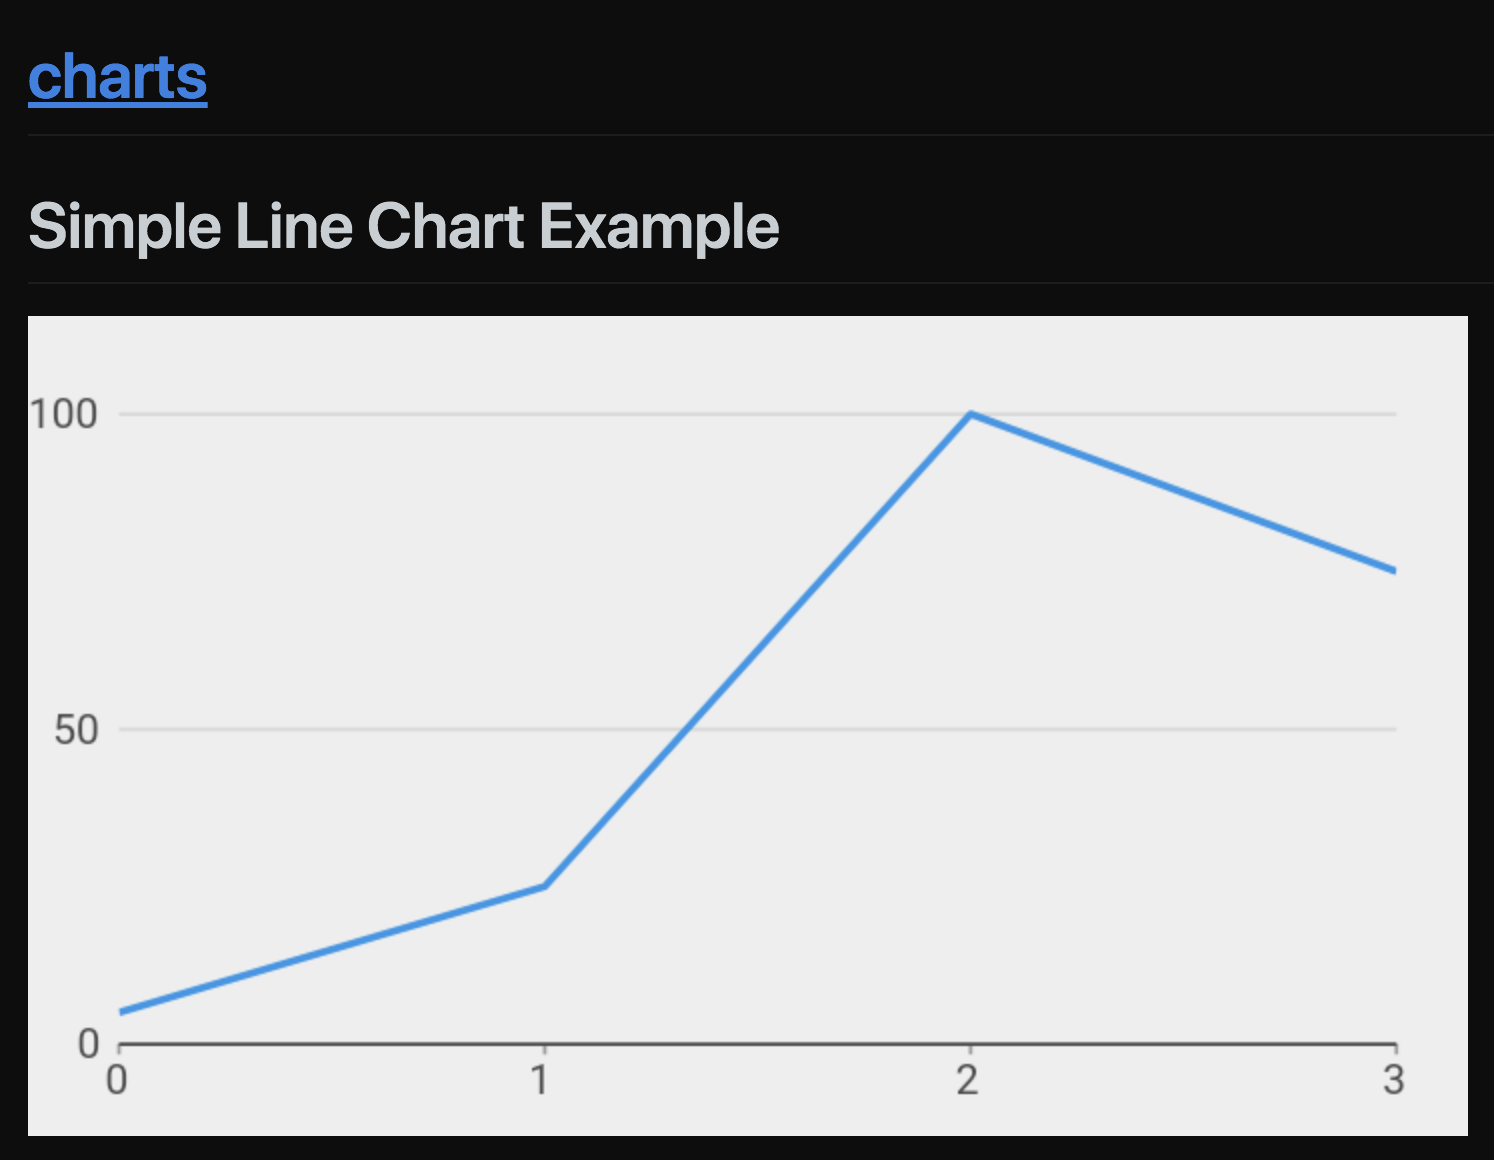
公司最近引入了 Flutter 技术栈,Flutter 是谷歌的移动 UI 框架,可以快速在 iOS 和 Android 上构建高质量的原生用户界面。然而由于 Flutter 还在早期发展阶段没有,生态建设还不够完善。比如项目中需要用到图表 UI 组件,经过一番调研,Google/charts 功能最强大,样式最丰富(详见 online gallery),于是引入到项目中。但是 charts 只实现了直线折线图,所以只能 fork charts 项目自己实现平滑曲线效果。

基础使用
- Goole/charts 这个图表库很强大,但是文档不太友好,只有 online gallery 上有纯示例代码,几乎没有 Api 说明。
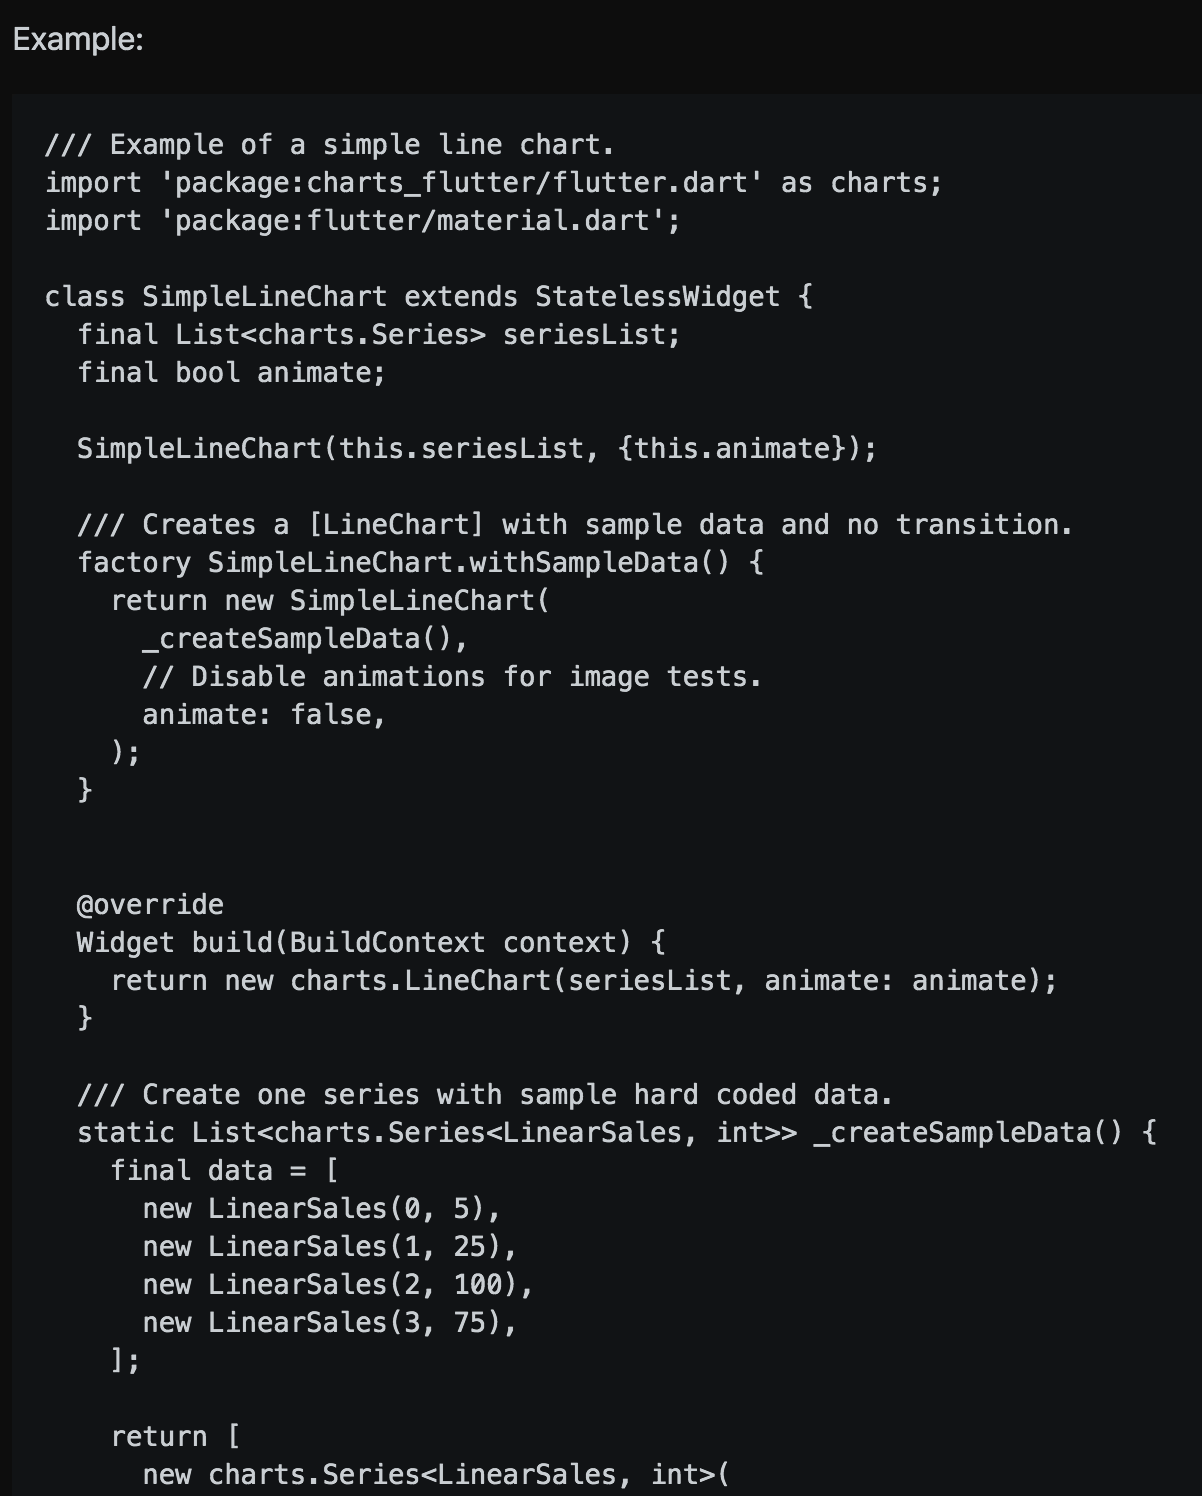
- 可行性分析的 Demo 效果

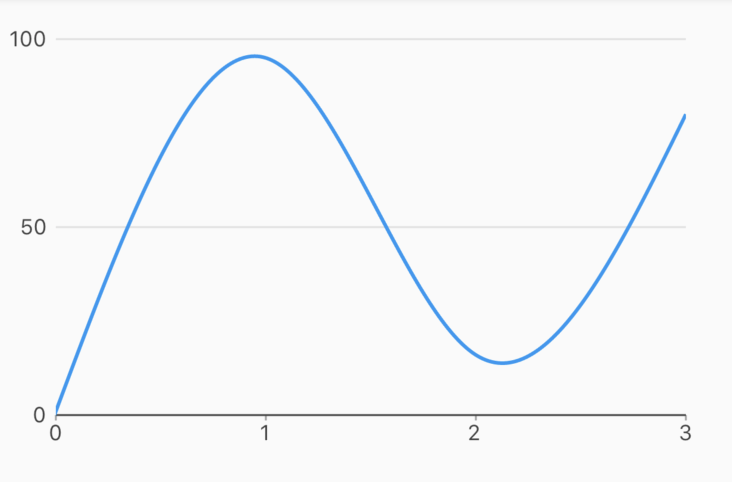
- 仔细研究优化后的效果

- 具体使用代码及注释
return Container(
  height: 150.0,
  child: charts.LineChart(
    _createChartData(), // 折线图的点的数据列表
    animate: true, // 动画
    defaultRenderer: charts.LineRendererConfig( // 折线图绘制的配置
      includeArea: true,
      includePoints: true,
      includeLine: true,
      stacked: false,
    ),
    domainAxis: charts.NumericAxisSpec( // 主轴的配置
      tickFormatterSpec: DomainFormatterSpec(widget.dateRange), // tick 值的格式化,这里把 num 转换成 String
      renderSpec: charts.SmallTickRendererSpec( // 主轴绘制的配置
        tickLengthPx: 0, // 刻度标识突出的长度
        labelOffsetFromAxisPx: 12, // 刻度文字距离轴线的位移
        labelStyle: charts.TextStyleSpec( // 刻度文字的样式
          color: ChartUtil.getChartColor(HColors.lightGrey),
          fontSize: HFontSizes.smaller.toInt(),
        ),
        axisLineStyle: charts.LineStyleSpec( // 轴线的样式
          color: ChartUtil.getChartColor(ChartUtil.lightBlue),
        ),
      ),
      tickProviderSpec: charts.BasicNumericTickProviderSpec( // 轴线刻度配置
        dataIsInWholeNumbers: false,
        desiredTickCount: widget.data.length, // 期望显示几个刻度
      ),
    ),
    primaryMeasureAxis: charts.NumericAxisSpec( // 交叉轴的配置,参数参考主轴配置
      showAxisLine: false, // 显示轴线
      tickFormatterSpec: MeasureFormatterSpec(),
      tickProviderSpec: charts.BasicNumericTickProviderSpec(
        dataIsInWholeNumbers: false,
        desiredTickCount: 4,
      ),
      renderSpec: charts.GridlineRendererSpec( // 交叉轴刻度水平线
        tickLengthPx: 0,
        labelOffsetFromAxisPx: 12,
        labelStyle: charts.TextStyleSpec(
          color: ChartUtil.getChartColor(HColors.lightGrey),
          fontSize: HFontSizes.smaller.toInt(),
        ),
        lineStyle: charts.LineStyleSpec(
          color: ChartUtil.getChartColor(ChartUtil.lightBlue),
        ),
        axisLineStyle: charts.LineStyleSpec(
          color: ChartUtil.getChartColor(ChartUtil.lightBlue),
        ),
      ),
    ),
    selectionModels: [ // 设置点击选中事件
      charts.SelectionModelConfig(
        type: charts.SelectionModelType.info,
        listener: _onSelectionChanged,
      )
    ],
    behaviors: [
      charts.InitialSelection(selectedDataConfig: [ // 设置默认选中
        charts.SeriesDatumConfig<num>('LineChart', _index)
      ]),
    ],
  ),
);
平滑曲线效果实现
虽然基础使用实现的折线图效果已经很不错了,但 UI 设计是平滑曲线效果,工程师也赞同曲线效果更优雅的观点,所以决定挑战自我,自己实现平滑曲线效果。 通过一层层源码分析,最终发现绘制折线图折线的实现位置,改写该实现即可实现平滑曲线效果
line_chart.dart
defaultRenderer: charts.LineRendererConfig( // 折线图绘制的配置
  includeArea: true,
  includePoints: true,
  includeLine: true,
  stacked: false,
),
line_renderer.dart
if (config.includeLine) {
   ...
        canvas.drawLine(
            clipBounds: _getClipBoundsForExtent(line.positionExtent),
            dashPattern: line.dashPattern,
            points: line.points,
            stroke: line.color,
            strokeWidthPx: line.strokeWidthPx,
            roundEndCaps: line.roundEndCaps);
      }
    });
  }
});
chart_canvas.dart
@override
void drawLine(
   ...
  _linePainter.draw(
      canvas: canvas,
      paint: _paint,
      points: points,
      clipBounds: clipBounds,
      fill: fill,
      stroke: stroke,
      roundEndCaps: roundEndCaps,
      strokeWidthPx: strokeWidthPx,
      dashPattern: dashPattern);
}
既然找到了具体绘制折线的入口,剩下的就是如何根据给出的数据集合,绘制出平滑的曲线,而且曲线的范围不能超出数据集合的范围。前前后后尝试了三种绘制曲线的算法,前两种都由于超出数据集合范围而弃用了,最后的曲线效果采用的第三种算法绘制的。
样条插值是一种工业设计中常用的、得到平滑曲线的一种插值方法,三次样条又是其中用的较为广泛的一种。算法参考 Java 三次样条插值,代码实现如下: interpolation.dart
class Interpolation {
  int n;
  List<num> xs;
  List<num> ys;

  bool spInitialized;
  List<num> spY2s;

  Interpolation(List<num> _xs, List<num> _ys) {
    this.n = _xs.length;
    this.xs = _xs;
    this.ys = _ys;
    this.spInitialized = false;
  }

  num spline(num x) {
    if (!this.spInitialized) {
      // Assume Natural Spline Interpolation
      num p, qn, sig, un;
      List<num> us;

      us = new List<num>(n - 1);
      spY2s = new List<num>(n);
      us[0] = spY2s[0] = 0.0;

      for (int i = 1; i <= n - 2; i++) {
        sig = (xs[i] - xs[i - 1]) / (xs[i + 1] - xs[i - 1]);
        p = sig * spY2s[i - 1] + 2.0;
        spY2s[i] = (sig - 1.0) / p;
        us[i] = (ys[i + 1] - ys[i]) / (xs[i + 1] - xs[i]) -
            (ys[i] - ys[i - 1]) / (xs[i] - xs[i - 1]);
        us[i] = (6.0 * us[i] / (xs[i + 1] - xs[i - 1]) - sig * us[i - 1]) / p;
      }
      qn = un = 0.0;

      spY2s[n - 1] = (un - qn * us[n - 2]) / (qn * spY2s[n - 2] + 1.0);
      for (int k = n - 2; k >= 0; k--) {
        spY2s[k] = spY2s[k] * spY2s[k + 1] + us[k];
      }

      this.spInitialized = true;
    }

    int klo, khi, k;
    num h, b, a;

    klo = 0;
    khi = n - 1;
    while (khi - klo > 1) {
      k = (khi + klo) >> 1;
      if (xs[k] > x)
        khi = k;
      else
        klo = k;
    }
    h = xs[khi] - xs[klo];
    if (h == 0.0) {
      throw new Exception('h==0.0');
    }
    a = (xs[khi] - x) / h;
    b = (x - xs[klo]) / h;
    return a * ys[klo] +
        b * ys[khi] +
        ((a * a * a - a) * spY2s[klo] + (b * b * b - b) * spY2s[khi]) *
            (h * h) /
            6.0;
  }
}
line_painter.dart
/// Draws smooth lines between each point.
void _drawSmoothLine(Canvas canvas, Paint paint, List<Point> points) {
  var interval = 0.1;
  var interpolationPoints = List<Point>();
  for (int k = 0; k < points.length; k++) {
    if ((k + 1) < points.length) {
      num temp = 0;
      while (temp < points[k + 1].x) {
        temp = temp + interval;
        interpolationPoints.add(Point(temp, 0.0));
      }
    }
  }
  var tempX = points.map((item) => item.x).toList();
  var tempY = points.map((item) => item.y).toList();
  var ip = Interpolation(tempX, tempY);
  for (int j = 0; j < interpolationPoints.length; j++) {
    interpolationPoints[j] =
        Point(interpolationPoints[j].x, ip.spline(interpolationPoints[j].x));
  }
  interpolationPoints.addAll(points);
  interpolationPoints.sort((a, b) {
    if (a.x == b.x)
      return 0;
    else if (a.x < b.x)
      return -1;
    else
      return 1;
  });
  final path = new Path();
  path.moveTo(interpolationPoints[0].x.toDouble(), interpolationPoints[0].y.toDouble());
  for (int i = 1; i < interpolationPoints.length; i++) {
    path.lineTo(interpolationPoints[i].x.toDouble(), interpolationPoints[i].y.toDouble());
  }
  canvas.drawPath(path, paint);
}
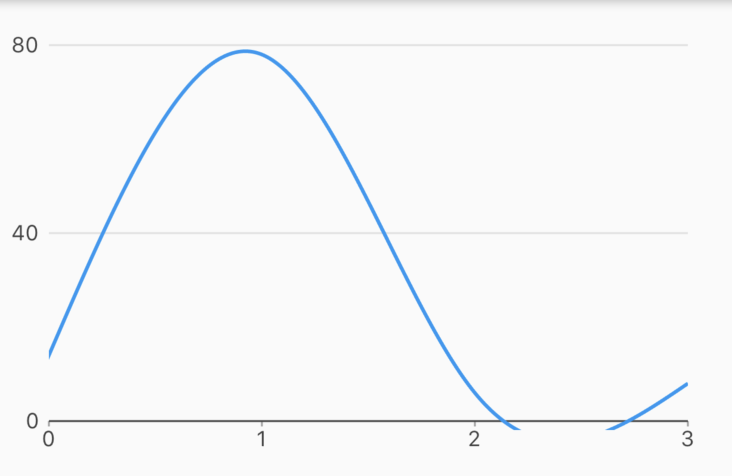
最终效果图
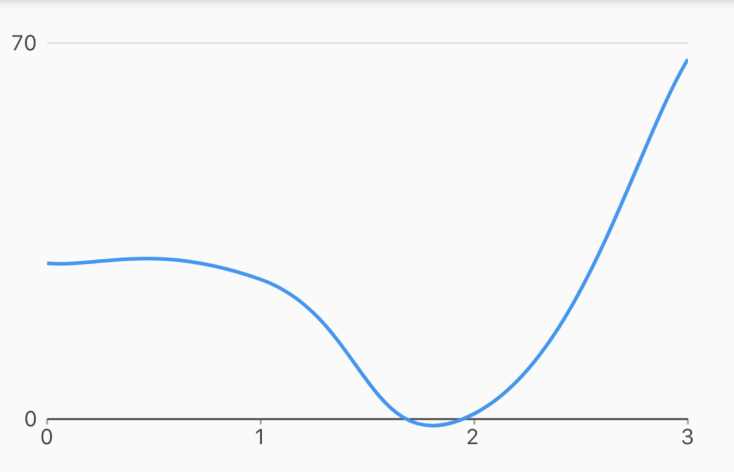
看起来效果还是挺完美的,但是其实有个致命问题,曲线的顶点可能会超出折线图数据的范围
三次贝塞尔曲线就是这样的一条曲线,它是依据四个位置任意的点坐标绘制出的一条光滑曲线,其难点是两个控制点的计算,算法参考 贝塞尔曲线平滑拟合折线段,代码实现如下: line_painter.dart
/// Draws smooth lines between each point.
void _drawSmoothLine(Canvas canvas, Paint paint, List<Point> points) {
  var targetPoints = List<Point>();
  targetPoints.add(points[0]);
  targetPoints.addAll(points);
  targetPoints.add(points[points.length - 1]);
  final path = new Path();
  for (int i = 1; i < targetPoints.length - 2; i++) {
    path.moveTo(
        targetPoints[i].x.toDouble(), targetPoints[i].y.toDouble());
    var controllerPoint1 = Point(
      targetPoints[i].x + (targetPoints[i + 1].x - targetPoints[i - 1].x) / 4,
      targetPoints[i].y + (targetPoints[i + 1].y - targetPoints[i - 1].y) / 4,
    );
    var controllerPoint2 = Point(
      targetPoints[i + 1].x - (targetPoints[i + 2].x - targetPoints[i].x) / 4,
      targetPoints[i + 1].y - (targetPoints[i + 2].y - targetPoints[i].y) / 4,
    );
    path.cubicTo(
        controllerPoint1.x, controllerPoint1.y, controllerPoint2.x,
        controllerPoint2.y, targetPoints[i + 1].x, targetPoints[i + 1].y);
  }
  canvas.drawPath(path, paint);
}
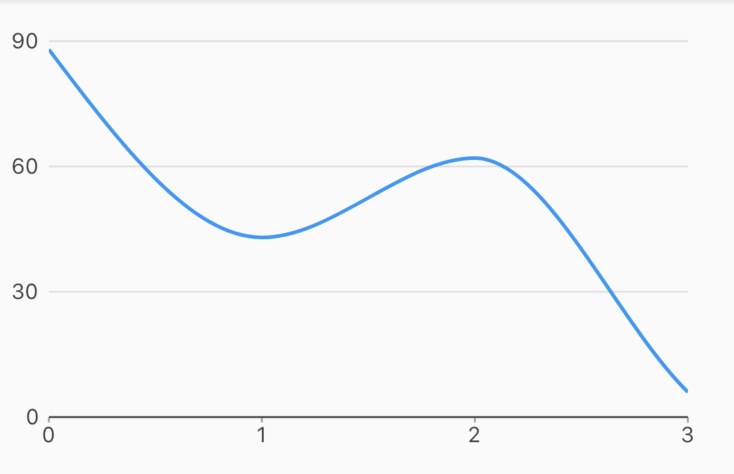
平滑曲线效果也是可以实现的,但是依然存在顶点越界的问题
- 贝塞尔曲线(MonotoneX)
因为之前 RN 项目用到了 victory-native / victory-chart,通过源码和文档发现它的曲线效果实现是依赖了 d3-shap 的 d3.curveMonotoneX,算法参考 monotone.js,实现代码如下:
注:由于算法需要当前点和前两个点才能画出一段曲线,所以在折线点数据集合最后人为添加了一个点,否则画出来的曲线会缺少最后一段
line_painter.dart
/// Draws smooth lines between each point.
void _drawSmoothLine(Canvas canvas, Paint paint, List<Point> points) {
  var targetPoints = List<Point>();
  targetPoints.addAll(points);
  targetPoints.add(Point(
      points[points.length - 1].x * 2, points[points.length - 1].y * 2));
  var x0,
      y0,
      x1,
      y1,
      t0,
      path = Path();
  for (int i = 0; i < targetPoints.length; i++) {
    var t1;
    var x = targetPoints[i].x;
    var y = targetPoints[i].y;
    if (x == x1 && y == y1) return;
    switch (i) {
      case 0:
        path.moveTo(x, y);
        break;
      case 1:
        break;
      case 2:
        t1 = MonotoneX.slope3(x0, y0, x1, y1, x, y);
        MonotoneX.point(
            path,
            x0,
            y0,
            x1,
            y1,
            MonotoneX.slope2(x0, y0, x1, y1, t1),
            t1);
        break;
      default:
        t1 = MonotoneX.slope3(x0, y0, x1, y1, x, y);
        MonotoneX.point(
            path,
            x0,
            y0,
            x1,
            y1,
            t0,
            t1);
    }
    x0 = x1;
    y0 = y1;
    x1 = x;
    y1 = y;
    t0 = t1;
  }
  canvas.drawPath(path, paint);
}
最终效果图,顶点都是折线图数据集合里的点,完美!
- 源码
详见 GitHub dev 分支 github.com/123lxw123/c…
本文版权属于再惠研发团队,欢迎转载,转载请保留出处。@123lxw123
