Echart + 百度地图实现区域聚合(Vue版)
百度地图的聚合很简单,但是根据区域聚合怎么实现呢?结合Echart的百度地图怎么实现区域聚合呢?
单独玩过Echart,也单独用过百度地图,但是两个结合起来使用还整没用过呢, Echart的API中有相应的地图注册方法,那么一般地图都是需要加载底图的,在Echart中加载地图底图的方式有三种。
Echart中加载地图底图
百度地图
使用百度地图时,我们需要先引入百度地图API,然后在series中引入的其他要素层中,coordinateSystem的值必须设置为bmap,也就是其他层的数据,以bmap地图作为空间坐标系统的参考;
const options = {
        bmap: {
            center: [108.95, 34.27], // 西安
            zoom: 6,
            roam: true,
            label: {
                show: true,
            },
            mapStyle:{
                styleJson: mapStyle, // 定义bmap的样式
            },
        }
        series: [{
            type: 'scatter',
            // 注意这个地方一定要设置为bmap
            coordinateSystem: 'bmap',
            data: data,
          }
       ]
     }
json方式注册地图(registerMap)
这种方式底图数据以json(geojson)格式存储,在获取json格式的数据后,采用registerMap进行手动注册,给地图取一个名字。EChart中使用的方法,可参考官方示例;
fetch('/get/china.json', (china) => {
    echart.registerMap('china', china);
})

const options = {
        series: [{
            type: 'map',
            map: 'china', // 这里设置自己的注册的map
            data: data,
          }
       ]
     }
series中的map为用户自己注册的地图。registerMap只能注册面状要素的json数据,对点、线无效!
script 引入结合geo方式
这种方式的底图数据,可以直接用 script 标签引入包含数据的 js 文件,引入后会自动注册地图名字和数据,如,引入后EChart自动对地图进行注册
const options = {
        geo: {
            center: [108.95, 34.27], // 西安
            zoom: 6,
            roam: true,
            label: {
                show: true,
            },
            mapStyle:{
                styleJson: mapStyle, // 定义bmap的样式
            },
        }
        series: [{
            type: 'scatter',
            // 注意这个地方一定要设置为geo
            coordinateSystem: 'geo',
            data: data,
          }
       ]
     }
series中的coordinateSystem必须设置为 geo,即采用的坐标系统参考与geo中定义的地图保持一致;geo方式也只适用于面状地图数据,对点和线要素数据无效!
我们的这个需求既有点要素,也有线要素, Echart点、线要素加载
series中type设置为line/lines实现线要素。 series中type设置为scatter/effectScatter实现点要素。
参数coordinateSystem设置为bmap(百度地图),
Echart + 百度地图实现多点
const options = {
    bmap: {
        center: [108.95, 34.27], // 西安
        zoom: 6,
        roam: true,
        label: {
            show: true,
        },
        mapStyle:
            {
                styleJson: mapStyle,
            },
    },
    title: {
        text: '网络线路分布',
        left: 'center',
        textStyle: {
            color: '#fff',
        },
    },
    tooltip: {
        trigger: 'item',
    },
    series: [
    {
        type: 'scatter',
        coordinateSystem: 'bmap',
        data: this.covertStopData(),
        tooltip: {
            formatter: '{b}',
        },
        symbolSize: 20,
        label: {
            normal: {
                formatter: '{b}',
                position: 'inside',
                show: true,
            },
            emphasis: {
                show: true,
            },
        },
        itemStyle: {
            normal: {
                color: '#fff',
            },
        },
        zlevel: 1,
    }],
};
也可以使用effectScatter啊, 效果如下:
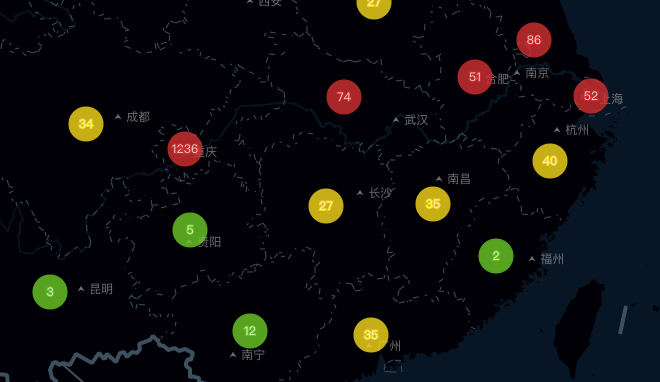
Echart + 百度地图实现多点按照行政区域聚合
我们之前在使用百度地图的时候都知道啊,百度地图的聚合是不能做到按照行政区域来聚合的,他的一个聚合方式我也没用深入研究过,但是现在我们要是实现按照行政区域聚合怎么处理呢? 于是我求助了后端。哈哈哈 分三个等级,
zoom [百度缩放比例]
<= 6 [表示省份,请求省份数据]
<=8 && > 6 [表示市,请求市级数据]
> 8 [表示区, 请求区域数据]
根据zoom的变化,来update图表的显示数据 添加监听器事件“bmaproam”,当zoom变化时从新请求数据。并且update图表
this.myChart =window.echarts.init(document.getElementById('chart'));
this.myChart.on('bmaproam', () => {
    const _options = this.myChart.getOption();
    const zoom = _options.bmap[0].zoom;
    if (zoom === this.defaultZoom) return;
    if (zoom > 8) {
        this.stop_level = 3;
    } else if (zoom > 6 && zoom <= 8) {
        this.stop_level = 2;
    } else if (zoom <= 6) {
        this.stop_level = 1;
    }
    this.defaultZoom = zoom;
    this.fetchData();
});
整合数据,根据不同的level设置不同的点大小
 covertStopData() {
    const res = [];
    const data = this.stopData;
    const colors = ['#79D12E', '#F9DE1C', '#DA3838'];
    const size = [35, 25, 20];
    const length = data.length;
    for (let i = 0; i < length; i++) {
    res.push({
        name: data[i].name,
        value: [data[i].lng, data[i].lat, data[i].total],
        itemStyle: {
            // color按照自己的需求设置,
            color: colors[data[i].level - 1],
        },
        symbolSize: size[this.stop_level - 1],
    });
    }
    return res;
}
Echart部分代码
const options = {
    bmap: {
        center: [108.95, 34.27], // 西安
        zoom: 6,
        roam: true,
        label: {
            show: true,
        },
        mapStyle:
            {
                styleJson: mapStyle,
            },
    },
    title: {
        text: '网络线路分布',
        left: 'center',
        textStyle: {
            color: '#fff',
        },
    },
    tooltip: {
        trigger: 'item',
    },
    series: [
    {
        type: 'scatter',
        coordinateSystem: 'bmap',
        data: this.covertStopData(),
        tooltip: {
            formatter: '{b}',
        },
        symbolSize: 20,
        label: {
            normal: {
                formatter: '{b}',
                position: 'inside',
                show: true,
            },
            emphasis: {
                show: true,
            },
        },
        itemStyle: {
            normal: {
                color: '#fff',
            },
        },
        zlevel: 1,
    }],
};
this.myChart.setOption(options);
效果如下: 区
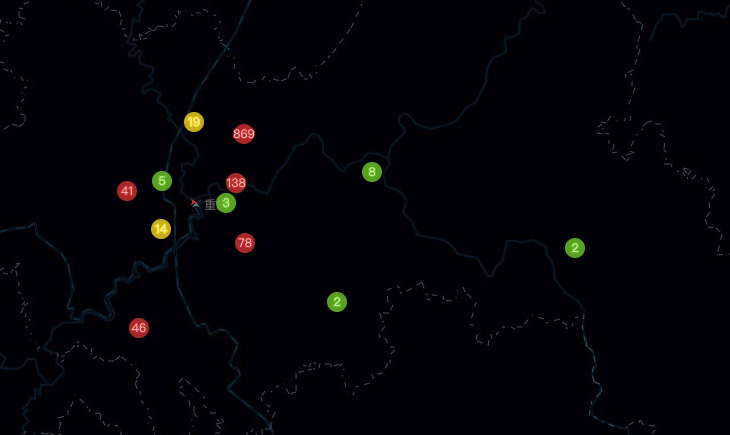
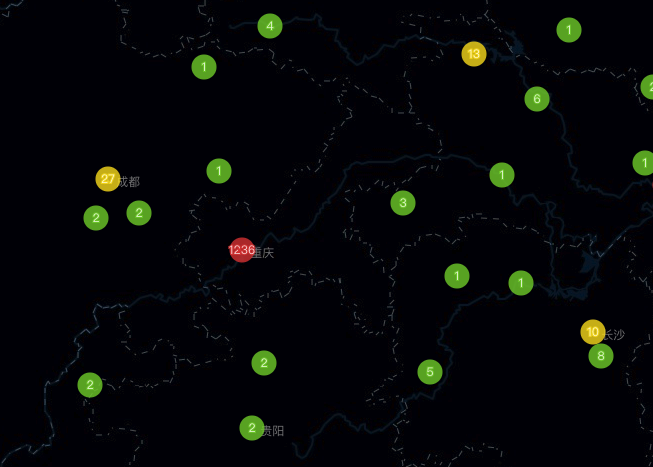
就这样实现了按区域聚合的功能
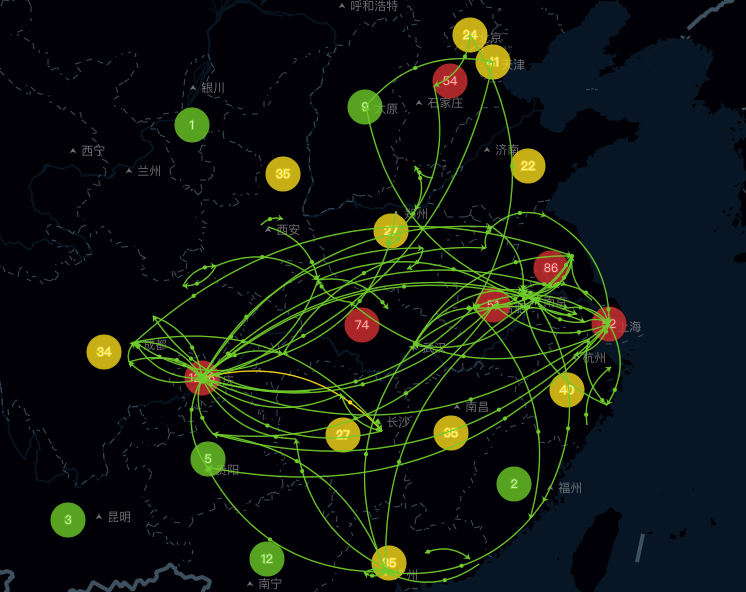
Echart + 百度地图实现多线路+多点
实现了多点,要实现多线路就很简单了,在series中的type设置为lines就可以了,
const options = {
    bmap: {
        center: [108.95, 34.27], // 西安
        zoom: 6,
        roam: true,
        label: {
            show: true,
        },
        mapStyle:
            {
                styleJson: mapStyle,
            },
    },
    title: {
        text: '网络线路分布',
        left: 'center',
        textStyle: {
            color: '#fff',
        },
    },
    tooltip: {
        trigger: 'item',
    },
    series: [
    {
        type: 'scatter',
        coordinateSystem: 'bmap',
        data: this.covertStopData(),
        tooltip: {
            formatter: '{b}',
        },
        symbolSize: 20,
        label: {
            normal: {
                formatter: '{b}',
                position: 'inside',
                show: true,
            },
            emphasis: {
                show: true,
            },
        },
        itemStyle: {
            normal: {
                color: '#fff',
            },
        },
        zlevel: 1,
    },
     {
        type: 'lines',
        coordinateSystem: 'bmap',
        polyline: false,
        slient: true,
        data: this.busLines,
        symbol: ['none', 'arrow'],
        symbolSize: 5,
        tooltip: {
            formatter: '{b}:{c}',
        },
        silent: true,
        label: {
            show: true,
            formatter: '{b}:{c}',
        },
        lineStyle: {
            normal: {
                opacity: 1,
                curveness: 0.3,
            },
        },
        progressiveThreshold: 500,
        progressive: 200,
        zlevel: 2,
    },
    {
        type: 'lines',
        coordinateSystem: 'bmap',
        polyline: false,
        data: this.busLines,
        lineStyle: {
            normal: {
                width: 1.5,
                curveness: 0.3,
            },
        },
        effect: {
            show: true,
            symbol: 'circle',
            constantSpeed: 40,
            trailLength: 0,
            symbolSize: 4,
        },
        animation: true,
        zlevel: 2,
    },
    ],
};
this.myChart.setOption(options);
注意,第一个lines是设置这一条线,第一个lines是设置沿着这条线跑的动画。 效果如下: