如何监控部署在云服务器网络层TCP/UDP连接状态指标?
推荐您使用 云监控-自定义监控 ! 目前内测阶段免费使用,无需审核,开通服务即用。诚邀您点击 申请页面 参与内测体验。
本文介绍如何使用 Shell 命令+SDK 方式上报网络层的关键指标数据至自定义监控,并在自定义监控上查看指标和配置告警。
实践背景
定期监控云服务器上网络层的关键指标,当这些监控指标触发您设置的告警条件时发送短信告警。
前提条件
- 购买了腾讯云 云服务器 CVM。
- 在云服务器安装 Python 2.7以上环境和 pip 工具。
数据上报
步骤1:准备上报环境
1.执行如下命令安装 Python 语言 SDK。
pip install tencentcloud-sdk-python
2.在云服务器上创建配置文件~/.ServerMonitor.json。配置文件内容如下:
{
"SecretId": "xxxxx",
"SecretKey": "xxxx",
"Region": "ap-guangzhou"
}
说明:
- Region:地域,可查询可用 地域列表。
3.输入如下 Shell 命令,限制该配置文件只有当前管理员有读写权限。
chmod 0600 ~/.ServerMonitor.json
步骤2:采集并上报数据
1.新建 ServerMonior.py 文件,内容如下,用于采集和上报数据。详细网络层指标说明请查看 指标说明。
#!/usr/bin/env python
#
# A simple server monitor demo use Tencent cloud PutMonitorData api
import json
import os
import re
import socket
import sys
import time

from tencentcloud.common import credential
from tencentcloud.common.profile.client_profile import ClientProfile
from tencentcloud.common.profile.http_profile import HttpProfile
from tencentcloud.common.exception.tencent_cloud_sdk_exception import TencentCloudSDKException
from tencentcloud.monitor.v20180724 import monitor_client, models

GLOBAL_CONF = None


def load_conf():
conf_path = os.path.expanduser("~/.ServerMonitor.json")
if not os.path.exists(conf_path):
print("config file %s not found!" % conf_path)
sys.exit(1)
config_error_msg = """load config error, sample format:
{
"SecretId": "xxxxxxx",
"SecretKey": "xxxxxxx",
"Region": "ap-guangzhou"
}
"""
try:
conf = json.loads(open(conf_path).read())
if not isinstance(conf, dict):
raise ValueError("config file format error")
except:
print(config_error_msg)
sys.exit(1)
if not conf.get("SecretId") or not conf.get("SecretKey") or not conf.get("Region"):
print(config_error_msg)
sys.exit(1)
return conf


def get_lan_ip():
"""
get lan ip use fake udp connection
this does not really 'connect' to any server
"""
# can be any routable address,
fake_dest = ("10.10.10.10", 53)
lan_ip = ""
try:
s = socket.socket(socket.AF_INET, socket.SOCK_DGRAM)
s.connect(fake_dest)
lan_ip = s.getsockname()[0]
s.close()
except Exception, e:
pass
# print >>sys.stderr, e
return lan_ip


class MonitorBase(object):

def __init__(self, sleep_time):
self.sleep_time = sleep_time
self.result1 = None;

def get_metrics(self):
"""
collect metrics from system
return metrics as dict: { "key1":v1, "key2": v2 }
"""
return {}

def process(self):
"""
call get_metrics twice between sleep_time and calc final result to report
return metrics as dict: { "key1":v1, "key2": v2 }
"""
result = self.get_metrics()
if self.sleep_time == 0:
return result

self.result1 = result
time.sleep(self.sleep_time)
result2 = self.get_metrics()
metrics = {}
for key in result2.keys():
metrics[key] = long(result2[key]) - long(result.get(key, 0))
# workaround value wrap
if metrics[key] < 0:
metrics[key] += 4294967296
return metrics

def report(self):
"""
report metrics to cloud api
:return:
"""
metrics = self.process()
try:
cred = credential.Credential(GLOBAL_CONF["SecretId"], GLOBAL_CONF["SecretKey"])
http_profile = HttpProfile()
http_profile.endpoint = "monitor.tencentcloudapi.com"

client_profile = ClientProfile()
client_profile.httpProfile = http_profile
client = monitor_client.MonitorClient(cred, GLOBAL_CONF["Region"], client_profile)

req = models.PutMonitorDataRequest()
from pprint import pprint
# limit metrics to report
metrics_allowed = ["TcpActiveOpens", "TcpPassiveOpens", "TcpAttemptFails", "TcpEstabResets",
"TcpRetransSegs", "TcpExtListenOverflows", "UdpInDatagrams", "UdpOutDatagrams",
"UdpInErrors", "UdpNoPorts", "UdpSndbufErrors"]
report_data = {"Metrics": [], "AnnounceInstance": get_lan_ip()}
for k, v in metrics.items():
if k in metrics_allowed:
report_data["Metrics"].append({"MetricName": k, "Value": v})
req.from_json_string(json.dumps(report_data))
pprint(report_data)
resp = client.PutMonitorData(req)
print(resp.to_json_string())
except TencentCloudSDKException as err:
print(err)


class NetMonitor(MonitorBase):
"""
parse /proc/net/snmp & /proc/net/netstat
"""

def get_metrics(self):
snmp_dict = {}
snmp_lines = open("/proc/net/snmp").readlines()
netstat_lines = open("/proc/net/netstat").readlines()
snmp_lines.extend(netstat_lines)

sep = re.compile(r'[:\s]+')
n = 0
for line in snmp_lines:
n += 1
fields = sep.split(line.strip())
proto = fields.pop(0)
if n % 2 == 1:
# header line
keys = fields
else:
# value line
try:
values = [long(f) for f in fields]
except Exception, e:
print e
kv = dict(zip(keys, values))
proto_dict = snmp_dict.setdefault(proto, {})
proto_dict.update(kv)
return snmp_dict


class NetSnmpIpTcpUdp(NetMonitor):
"""
Get ip/tcp/udp information from /proc/net/snmp
"""

def get_metrics(self):
snmp_dict = super(NetSnmpIpTcpUdp, self).get_metrics()
metrics = {}
for proto in ("Tcp", "Ip", "Udp", "Icmp", "TcpExt"):
if proto not in snmp_dict:
continue
for k, v in snmp_dict[proto].items():
k = proto + k
metrics[k] = v
return metrics

def process(self):
report_dict = super(NetSnmpIpTcpUdp, self).process()
# CurrEstab is a tmp value, not inc value
report_dict['TcpCurrEstab'] = self.result1['TcpCurrEstab']
return report_dict


if __name__ == "__main__":
GLOBAL_CONF = load_conf()
process_dict = {
NetSnmpIpTcpUdp: 60,
}
children = []
for key in process_dict.keys():
try:
pid = os.fork()
except OSError:
sys.exit("Unable to create child process!")
if pid == 0:
monitor = key(process_dict[key])
monitor.report()
sys.exit(0)
else:
children.append(pid)

for i in children:
os.wait()
代码中 SecretId、SecretKey、Region 等信息需要根据您的实际情况填写。 1.Region:地域,可查询可用 地域列表。 2.SecretId 和 SecretKey,请前往 API 密钥管理 获取。
2.下载完后,将 ServerMonior.py 文件放到/usr/local/bin目录下。
3.将 ServerMonior.py 添加到 crontab 计划任务中执行,即可自动完成网络层指标数据上报。
chmod a+x /usr/local/bin/ServerMonitor.py
crontab -l > /tmp/cron.bak
echo "* * * * * /usr/local/bin/ServerMonitor.py &> /tmp/ServerMonitor.log" >> /tmp/cron.bak
crontab /tmp/cron.bak
数据查询
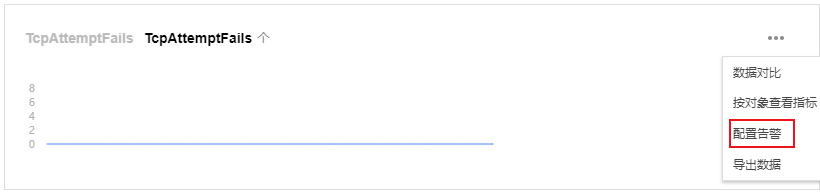
数据上报完成后,可以在 指标视图 看到刚才上报的数据。
1.配置告警和接收告警仅做一个场景举例。 2.配置网络层上报过的其它指标配置,请执行以下配置告警中的步骤2 - 3。
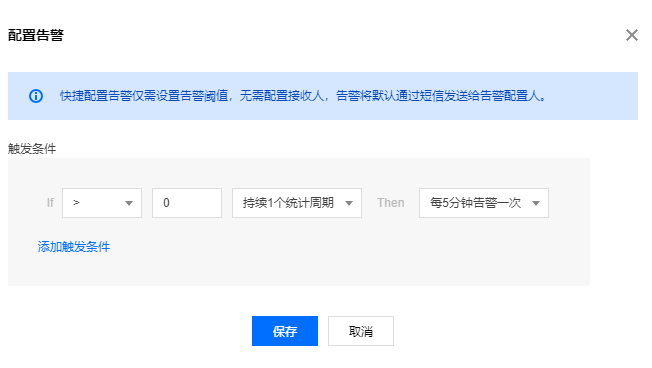
配置告警
场景:定期监控网络层中 Tcp 连接失败数,当 Tcp 连接失败次数大于0时发送短信告警。
1.确认用户消息通道已验证,可在 CAM 鉴权 页面查看验证情况。

接收告警
如果 Tcp 连接失败数大于0,5分钟后将会收到短信告警,短信内容如下:
【腾讯云】云监控自定义监控指标告警触发
账号 ID:34xxxxxxxx,昵称:自定义监控
告警详情
告警内容:指标视图 | Tcp连接失败数大于0
告警对象:TcpAttemptFails
当前数据:1
APPID:125xxxxxxx
告警策略:视图告警
触发事件:2019-12-09 22:36:00(UTC+08:00)
指标说明
| 指标中文名 | 指标英文名 | 单位 |
|---|---|---|
| Tcp 主动连接 | TcpActiveOpens | 次 |
| Tcp 被动连接 | TcpPassiveOpens | 次 |
| Tcp 连接失败 | TcpAttemptFails | 次 |
| Tcp 连接异常断开 | TcpEstabResets | 次 |
| Tcp 重传的报文段总数 | TcpRetransSegs | 个 |
| Tcp 监听队列溢出 | TcpExtListenOverflows | 次 |
| UDP 入包量 | UdpInDatagrams | 个 |
| UDP 出包量 | udpOutDatagrams | 个 |
| UDP 入包错误数 | udpInErrors | 个 |
| UDP 端口不可达 | UdpNoPorts | 个 |
| UDP 发送缓冲区满 | UdpSndbufErrors | 次 |