


RedisTemplate.delete(Collection<K> keys)方法,那么,就需要注意了。
ps: 想看原因的直接翻到最后的讲解部分。
背景
上周通过监控发现系统突然出现大量的long-service,通过跟踪日志发现该请求中操作redis的耗时竟然高达500ms!
在进一步跟进日志后发现,最近出现了很多操作redis耗时过长的记录,而且奇怪的是,长耗时都是del操作,而set,get等都在0~1ms能完成。这里,基本上可以排除网络问题了
接下来还有更诡异的:
联系DBA,DBA小哥一脸肯定的说:服务端单个操作超过10ms就会告警,现在集群一切ok。
为了证实不是服务端的锅,还到集群的每个主节点上拉了redis的slowlog,很遗憾,里面并没有期待的del记录。所以,不得不承认,服务端也是没问题的
最小复现环境
为了更好的说明问题,我在本地搭建了一套最小的复现环境。
redis集群
必须是集群模式,我本地启动的为3主3从,端口从6380~6385。
详细信息如下:
127.0.0.1:6380> cluster nodes
1e5df367880965ead5b7064a2e4880db21b7aa94 127.0.0.1:6385@16385 slave 3f8598d3ec376d6f732c9921c2da9d48c825b1ad 0 1586069946810 6 connected
a136c7ed8206f0fa6fe73c02bf5f5d864fbc0f29 127.0.0.1:6383@16383 slave f658a0138f70acbd880928930efa19eebba1098a 0 1586069945000 4 connected
f658a0138f70acbd880928930efa19eebba1098a 127.0.0.1:6381@16381 master - 0 1586069946000 2 connected 5461-10922
3872ab46cf6f316bc1d2a12c2d18e59e5d3a7e83 127.0.0.1:6384@16384 slave a3a7431d8bbaa1bc795433d59ab0dd8bc3fa2d2f 0 1586069947000 5 connected
3f8598d3ec376d6f732c9921c2da9d48c825b1ad 127.0.0.1:6380@16380 myself,master - 0 1586069945000 1 connected 0-5460
a3a7431d8bbaa1bc795433d59ab0dd8bc3fa2d2f 127.0.0.1:6382@16382 master - 0 1586069947821 3 connected 10923-16383
测试项目
主要是针对redisTemplate里面的删除操作,redis驱动我已经配置为jedis(版本无关)。
为了比较,我这里写了三种不同的service方法:
1 直接调用RedisTemplate.delete(Collection<K> keys)方法。
    @Override
    public void batchCollDel(List<String> list){
        redisTemplate.delete(list);
    }
2 使用普通的forEach方法,循环调用RedisTemplate.delete(K key)方法。
    @Override
    public void batchNormalDel(List< String> list){
        list.stream().forEach(redisTemplate::delete);
    }
3 使用并行流,调用RedisTemplate.delete(K key)方法。
    @Override
    public void batchParallelDel(List<String> list){
        list.parallelStream().forEach(redisTemplate::delete);
    }
为了观察上面三种执行的耗时,写了一个around切面,用来打印整个list执行完delete所消耗的时间:
 @Around(value = "methodPointCut()")
    public Object doAroundAdvice(ProceedingJoinPoint proceedingJoinPoint){
        String name = proceedingJoinPoint.getSignature().getName();
        StopWatch watch = new StopWatch();
        watch.start();
        Object proceed = null;
        try {
            proceed = proceedingJoinPoint.proceed();
            watch.stop();
            log.info("method:{} spend : {}",name,watch.getTime());
        } catch (Throwable throwable) {
            throwable.printStackTrace();
        }
        return proceed;
    }
好了,剩下的代码就是把上面的三个方法包成controller暴露出去,文章里面就不放了。
压测
首先声明一下,redis集群性能是够用的,rps轻轻松松上10w,大家可以自己用redis-benchmark跑一下。
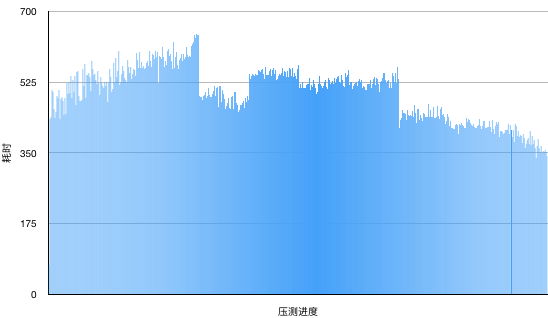
ab命令,先压一下普通的forEach循环删除:
ab -c 50 -n 500 http://localhost:8080/redis/batchNormalDel?size=1000
下面是ab返回的统计信息,算上生成随机字符串的时间,每个请求都在700ms以内完成:
Percentage of the requests served within a certain time (ms)
  50%    527
  66%    545
  75%    559
  80%    568
  90%    595
  95%    613
  98%    632
  99%    658
 100%    663 (longest request)
再看一下日志中打印的执行redis批量删除都消耗的时间:
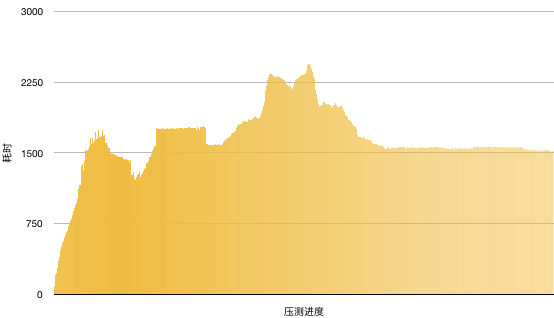
接下来,再压一下直接使用RedisTemplate.delete(Collection<K> keys)批量删除的效果:
ab -c 50 -n 500 http://localhost:8080/redis/batchCollDel?size=1000
要炸了。。在压测开始的时候耗时直线上升,最后每次批量删除维持在1500ms左右。
Percentage of the requests served within a certain time (ms)
  50%   1576
  66%   1757
  75%   1785
  80%   1854
  90%   2172
  95%   2308
  98%   2340
  99%   2399
 100%   2446 (longest request)
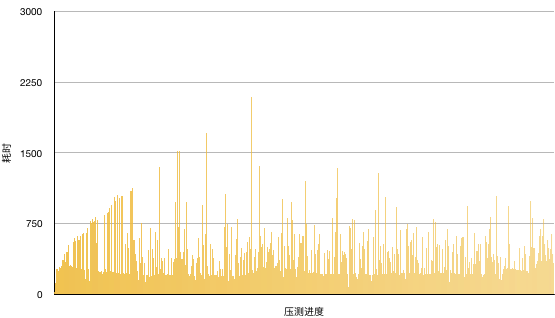
最后,再看看并行流的表现怎么样:
ab -c 50 -n 500 http://localhost:8080/redis/batchParallelDel?size=1000
看来并发也不是万能的 哈哈。
Percentage of the requests served within a certain time (ms)
  50%    383
  66%    490
  75%    572
  80%    639
  90%    797
  95%    989
  98%   1213
  99%   1462
 100%   2206 (longest request)
最后,一顿操作下来,检查一下slowlog(这里时间的单位是微妙)。
127.0.0.1:6380> config get slowlog-log-slower-than
1) "slowlog-log-slower-than"
2) "10000"
127.0.0.1:6380> slowlog get
(empty list or set)
127.0.0.1:6380>
讲解部分

spring-data:2.2.6.realease
jedis:3.2.0
下面看一下RedisTemplate相关的代码:
@Override
	public Long delete(Collection<K> keys) {
		if (CollectionUtils.isEmpty(keys)) {
			return 0L;
		}
		byte[][] rawKeys = rawKeys(keys);
		return execute(connection -> connection.del(rawKeys), true);
	}
没什么特别的,继续往下看:
因为是集群模式,所以对应的类是JedisClusterKeyCommands。
	@Override
	public Long del(byte[]... keys) {

		Assert.notNull(keys, "Keys must not be null!");
		Assert.noNullElements(keys, "Keys must not contain null elements!");

		if (ClusterSlotHashUtil.isSameSlotForAllKeys(keys)) {
			try {
				return connection.getCluster().del(keys);
			} catch (Exception ex) {
				throw convertJedisAccessException(ex);
			}
		}
		return (long) connection.getClusterCommandExecutor()
				.executeMultiKeyCommand((JedisMultiKeyClusterCommandCallback<Long>) (client, key) -> client.del(key),
						Arrays.asList(keys))
				.resultsAsList().size();
	}
这里判断传入的keys是否都是在redis节点中的同一个槽,在ClusterSlotHashUtil.isSameSlotForAllKeys里面会计算传入的所有key的slot值。
其实,因为集群中slot一般都是均匀分布的,批量删除落在同一个槽内的概率很小(除非特地group过),所有,大部分情况下都是走下面的executeMultiKeyCommand分支。
	public <S, T> MultiNodeResult<T> executeMultiKeyCommand(MultiKeyClusterCommandCallback<S, T> cmd,
			Iterable<byte[]> keys) {
		Map<RedisClusterNode, PositionalKeys> nodeKeyMap = new HashMap<>();
		int index = 0;
		for (byte[] key : keys) {
			for (RedisClusterNode node : getClusterTopology().getKeyServingNodes(key)) {
				nodeKeyMap.computeIfAbsent(node, val -> PositionalKeys.empty()).append(PositionalKey.of(key, index++));
			}
		}
		Map<NodeExecution, Future<NodeResult<T>>> futures = new LinkedHashMap<>();
		for (Entry<RedisClusterNode, PositionalKeys> entry : nodeKeyMap.entrySet()) {
			if (entry.getKey().isMaster()) {
				for (PositionalKey key : entry.getValue()) {
					futures.put(new NodeExecution(entry.getKey(), key),
							executor.submit(() -> executeMultiKeyCommandOnSingleNode(cmd, entry.getKey(), key.getBytes())));
				}
			}
		}
		return collectResults(futures);
	}
接下来会根据每个key所在redis node节点进行分组,计算好的结果如下:
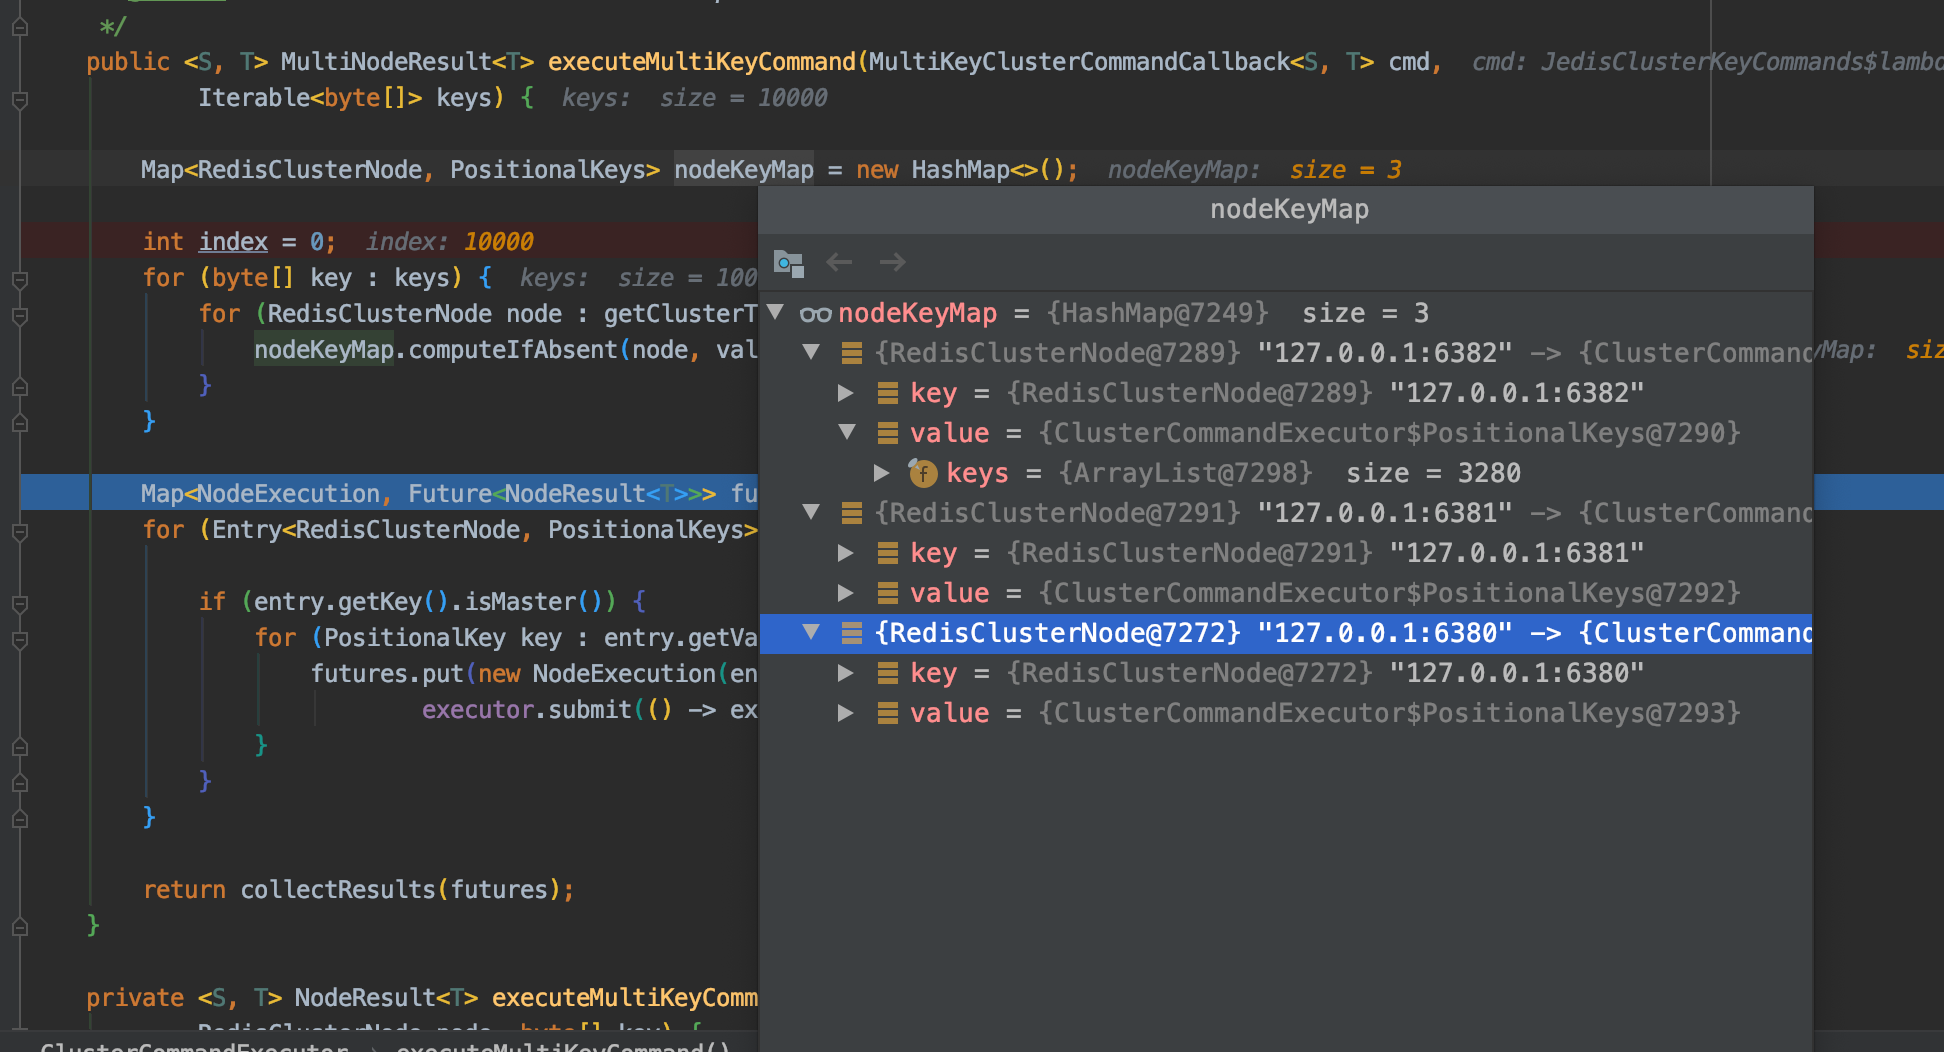
然后,使用Future向分别对应的主节点上异步提交命令。
在全部命令都提交完成后,使用collectResults(futures)方法等待所有的结果返回,也就是异步又转会了同步。
这代码这里就不放了,主要逻辑就是判断futures是否已经执行完成,没有完成的话就Thread.sleep(10)继续等。
关键问题出在提交执行任务的地方
executor.submit(() -> executeMultiKeyCommandOnSingleNode(cmd, entry.getKey(), key.getBytes()))
我们看一下这个executor对象:
他是一个AsyncTaskExecutor对象,那么,他的corePoolSize是多少呢?
在ClusterCommandExecutor中,一共有两个对方对executor进行初始化:
1 构造方法:
	public ClusterCommandExecutor(ClusterTopologyProvider topologyProvider, ClusterNodeResourceProvider resourceProvider,
			ExceptionTranslationStrategy exceptionTranslation, @Nullable AsyncTaskExecutor executor) {

		this(topologyProvider, resourceProvider, exceptionTranslation);
		this.executor = executor;
	}
但是,这个构造方法没有被任何一个地方使用。
2 代码块
	{
		if (executor == null) {
			ThreadPoolTaskExecutor threadPoolTaskExecutor = new ThreadPoolTaskExecutor();
			threadPoolTaskExecutor.initialize();
			this.executor = threadPoolTaskExecutor;
		}
	}
说实话,已经很少见到这种写法了。
这样创建出来的ThreadPoolTaskExecutor,他的几个关键属性是:
	private int corePoolSize = 1;
	private int maxPoolSize = Integer.MAX_VALUE;
	private int keepAliveSeconds = 60;
	private int queueCapacity = Integer.MAX_VALUE;
	private boolean allowCoreThreadTimeOut = false;
等待队列最大长度是Integer.MAX_VALUE
最大线程数是Integer.MAX_VALUE
在这种配置下,线程池始终只有一个线程在处理任务,只有等待队列满后才会创建第二个worker线程,然而,这个队列太大了。。。
其实,更可气的是,这个executor属性我们是没有办法配置的,他所在的类ClusterCommandExecutor也不是一个被Spring容器管理的类。
所以,问题已经找到了。由于集群模式下Spring对jedis的封装,在使用批量方法删除时会把任务都提交到仅有一个核心线程的executor中执行,在高并发场景下会造成应用内大量任务处于排队状态而得不到执行。
其他
相关的代码已上传到github github.com/huifrank/re…
包含有redis创建集群相关的脚本,可以使用docker,或者是直接在宿主机上启动。
如果是mac的话,还是不要用docker创建redis集群了。。mac下不支持docker的host网络模式(仅linux支持),如果使用桥接的话,由于spring执行cluster nodes拿到的是docker内的网络地址,尽管你配置的是执行过端口映射的地址,但是spring还是会用自己拿到的内网地址,一样启动不成功。
我搞了半天,放弃了。。。
