

现在如果在网络上搜的话,基本上大多数用于检测FPS的控件都是通过CADisplayLink来实现的。
CADisplayLink
官方文档对于CADisplayLink的介绍是:
A timer object that allows your application to synchronize its drawing to the refresh rate of the display.
即与屏幕刷新率同步的时间对象。
一般情况下,我们的屏幕刷新率是1/60s一次。CADisplayLink实际上跟平常用的NSTimer的用法基本相似,NSTimer的时间间隔是以秒为单位,而CADisplayLink则是使用帧率来作为时间间隔的单位。
利用CADisplayLink来实现FPS监测的常规做法如下:
var historyCount: Int = 0
var lastUpdateTimestamp: Double = 0
let displayLink = CADisplayLink(target: self, selector: #selector(step(displayLink:))

// ...

func step(displayLink: CADisplayLink) {
    if (lastUpdateTimestamp <= 0) {
        lastUpdateTimestamp = displayLink.timestamp
    }

    historyCount += 1
    let interval = displayLink.timestamp - lastUpdateTimestamp
    if (interval >= 1) {
        lastUpdateTimestamp = 0
        let fps = Double(historyCount) / interval
        print(fps)
        historyCount = 0
    }
}
核心思想为:在初始化CADisplayLink对象时,指定方法,该方法会在每次屏幕刷新,即每1/60秒调用一次,通过计算方法的调用次数以及时间间隔,来获取当前屏幕的fps
测试
根据上面的代码,我创建了一个tableView,在cell中各种圆角图片,反正就是怎么卡怎么来:
func tableView(_ tableView: UITableView, cellForRowAt indexPath: IndexPath) -> UITableViewCell {
    let cell = tableView.dequeueReusableCell(withIdentifier: "Cell")
    cell!.imageView!.image = UIImage(named: "00" + String(indexPath.row % 8 + 1))
    cell!.imageView!.layer.cornerRadius = 10
    cell!.imageView!.clipsToBounds = true
    cell!.imageView!.layer.shadowOffset = CGSize(width: 0, height: 5)
    cell!.imageView!.layer.shadowOpacity = 1

    if (indexPath.row % 3 == 0) {
        cell!.textLabel!.text = "上路 巩州遇虎熊五百年前一场疯腾霄又是孙悟空失马 鹰愁涧飞白龙沙河阻断 路难通福陵山中收天"
    } else if (indexPath.row % 3 == 1) {
        cell!.textLabel!.text = "岭上 前行逆黄风七星不照 波月洞千年白骨 化阴风鱼篮 网通天一尾红紫金葫芦二道童九尾老狐敢压龙白虹坠 雪浪击石碎思归 难归 堕回 轮回"
    } else {
        cell!.textLabel!.text = "红霓垂 九重紫云飞久归 未归 欲回 恨回凡胎恰登对 天命难违比丘走白鹿 十三娘情丝缠缚乌袍君生百目庙前拦路自称黄眉老祖"
    }

    cell!.textLabel!.backgroundColor = UIColor.clear
    cell!.textLabel!.layer.shadowOffset = CGSize(width: 0, height: 2)
    cell!.textLabel!.layer.shadowOpacity = 1
    cell!.textLabel!.numberOfLines = 0

    return cell!
}
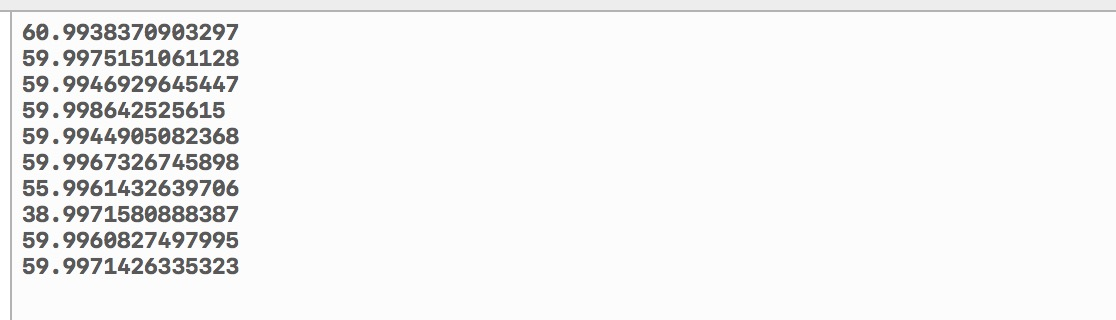
在运行时可以看到,打印出来的帧率为:
可是通过Instrument的Core Animation进行监测的时候,其结果却是:
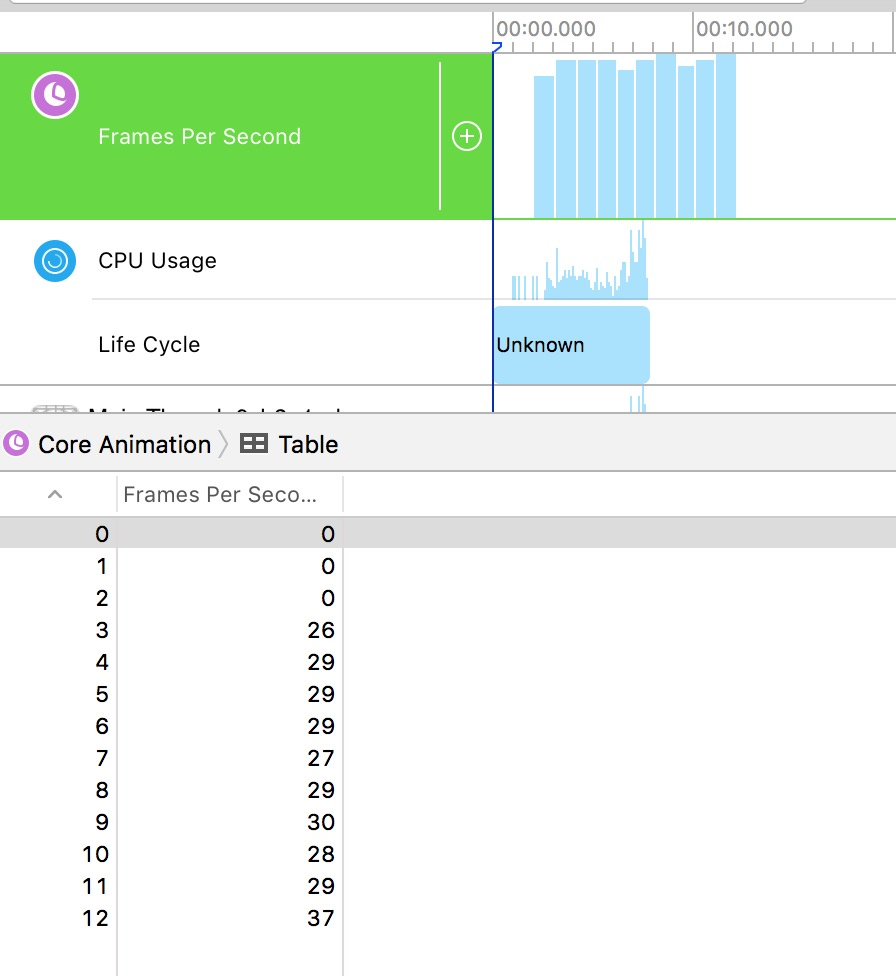
两者完全就对不上啊。
在这篇文章中,发现作者也遇到相同的问题:iOS中基于CADisplayLink的FPS指示器详解
根据大神ibireme的文章iOS 保持界面流畅的技巧的介绍,我们能够知道在屏幕中显示图像的过程中,CPU负责计算显示内容,进行诸如视图创建,布局计算,图片解码等工作,然后将数据提交到GPU上,而GPU对这些图像数据进行变换,渲染之后,会把图像提交到帧缓冲区,然后在下一次同步信号来临的时候,将图像显示到屏幕上。然后GPU就切换指向到另一个帧缓冲区,重复上述工作。
由此可以得知,因为CADisplayLink的运行取决于RunLoop。而RunLoop的运行取决于其所在的mode以及CPU的繁忙程度,当CPU忙于计算显示内容或者GPU工作太繁重时,就会导致显示出来的FPS与Instrument的不一致。
故使用CADisplayLink并不能很准确反映当前屏幕的FPS!
主线程卡顿监测
由于CADisplayLink并不能够准确反映出来,所以常用的方法时主线程卡顿监测。通过开辟一个子线程来监测主线程的RunLoop,当两个状态区域的耗时大于设定的阈值时,即为一次卡顿。
根据如何监控卡顿的介绍,可以得知主线程卡顿监测的原理以及做法。
结论
根据CADisplayLink写了一个小工具:KJFPSLabel
