

一些内存相关的名词
虚拟内存VM
虚拟内存机制在这里就不多说了,主要包括内存管理单元MMU、内存映射、分段、分页。在iOS中,一页通常有16KB的内存空间。
分配内存的时候,先分配虚拟内存,然后使用的时候再映射到实际的物理内存。
一个VM Region指的是一段连续的虚拟内存页,这些页的属性都相同。
/* localized structure - cannot be safely passed between tasks of differing sizes */
/* Don't use this, use MACH_TASK_BASIC_INFO instead */
struct task_basic_info {
    integer_t       suspend_count;  /* suspend count for task */
    vm_size_t       virtual_size;   /* virtual memory size (bytes) */
    vm_size_t       resident_size;  /* resident memory size (bytes) */
    time_value_t    user_time;      /* total user run time for
                                     *  terminated threads */
    time_value_t    system_time;    /* total system run time for
                                     *  terminated threads */
    policy_t        policy;         /* default policy for new threads */
};

struct mach_task_basic_info {
    mach_vm_size_t  virtual_size;       /* virtual memory size (bytes) */
    mach_vm_size_t  resident_size;      /* resident memory size (bytes) */
    mach_vm_size_t  resident_size_max;  /* maximum resident memory size (bytes) */
    time_value_t    user_time;          /* total user run time for
                                         *  terminated threads */
    time_value_t    system_time;        /* total system run time for
                                         *  terminated threads */
    policy_t        policy;             /* default policy for new threads */
    integer_t       suspend_count;      /* suspend count for task */
};
VM分为Clean Memory和Dirty Memory。即:
虚拟内存 Virtual Memory = Dirty Memory + Clean Memory + Compressed Memory。
使用malloc函数,申请一段堆内存,则该内存为Clean的。一旦写入数据,通常这块内存会变成Dirty。
获取App申请到的所有虚拟内存:
- (int64_t)memoryVirtualSize {
    struct task_basic_info info;
    mach_msg_type_number_t size = (sizeof(task_basic_info_data_t) / sizeof(natural_t));
    kern_return_t ret = task_info(mach_task_self(), TASK_BASIC_INFO, (task_info_t)&info, &size);
    if (ret != KERN_SUCCESS) {
        return 0;
    }
    return info.virtual_size;
}
mach_task_self()表示获取当前的Mach task。
Clean Memory
可以简单理解为能够被写入数据的干净内存。对开发者而言是read-only,而iOS系统可以写入或移除。
- System Framework、Binary Executable占用的内存
- 可以被释放(Page Out,iOS上是压缩内存的方式)的文件,包括内存映射文件Memory mapped file(如image、data、model等)。内存映射文件通常是只读的。
- 系统中可回收、可复用的内存,实际不会立即申请到物理内存,而是真正需要的时候再给。
- 每个framework都有_DATA_CONST段,当App运行时使用到了某个framework,该framework对应的_DATA_CONST的内存就由clean变为dirty了。
注意:如果通过文件内存映射机制memory mapped file载入内存的,可以先清除这部分内存占用,需要的时候再从文件载入到内存。所以是Clean Memory。
Dirty Memory
主要强调不可被重复使用的内存。对开发者而言,已经写入数据。
- 被写入数据的内存,包括所有heap中的对象、图像解码缓冲(ImageIO, CGRasterData,IOSurface)。
- 已使用的实际物理内存,系统无法自动回收。
- heap allocation、caches、decompressed images。
- 每个framework的_DATA段和_DATA_DIRTY段。
iOS中的内存警告,只会释放clean memory。因为iOS认为dirty memory有数据,不能清理。所以,应尽量避免dirty memory过大。
要清楚地知道Allocations和Dirty Size分别是因为什么?
值得注意的是,在使用 framework 的过程中会产生 Dirty Memory,使用单例或者全局初始化方法是减少 Dirty Memory 不错的方法,因为单例一旦创建就不会销毁,全局初始化方法会在 class 加载时执行。
下方有测量实验,如+50dirty的操作,在release环境不生效,因iOS系统自动做了优化。
Compressed Memory
iOS设备没有swapped memory,而是采用Compressed Memory机制,一般情况下能将目标内存压缩至原有的一半以下。对于缓存数据或可重建数据,尽量使用NSCache或NSPurableData,收到内存警告时,系统自动处理内存释放操作。并且是线程安全的。
这里要注意,压缩内存机制,使得内存警告与释放内存变得稍微复杂一些。即,对于已经被压缩过的内存,如果尝试释放其中一部分,则会先将它解压。而解压过程带来的内存增大,可能得到我们并不期待的结果。如果选用NSDictionary之类的,内存比较紧张时,尝试将NSDictionary的部分内存释放掉。但若NSDictionary之前是压缩状态,释放需要先解压,解压过程可能导致内存增大而适得其反。
所以,我们平常开发所关心的内存占用其实是 Dirty Size和Compressed Size两部分,也应尽量优化这两部分。而Clean Memory一般不用太多关注。
Resident Memory
已经被映射到虚拟内存中的物理内存。而phys_footprint才是真正消耗的物理内存。
Resident Memory = Dirty Memory + Clean Memory that loaded in pysical memory。
获取App消耗的Resident Memory:
- (int64_t)memoryResidentSize {
    struct task_basic_info info;
    mach_msg_type_number_t size = sizeof(task_basic_info_data_t) / sizeof(natural_t);
    kern_return_t ret = task_info(mach_task_self(), TASK_BASIC_INFO, (task_info_t)&info, &size);
    if (ret != KERN_SUCCESS) {
        return 0;
    }
    return info.resident_size;
}
Memory Footprint
/*
* phys_footprint
*   Physical footprint: This is the sum of:
*     + (internal - alternate_accounting)
*     + (internal_compressed - alternate_accounting_compressed)
*     + iokit_mapped
*     + purgeable_nonvolatile
*     + purgeable_nonvolatile_compressed
*     + page_table
*
* internal
*   The task's anonymous memory, which on iOS is always resident.
*
* internal_compressed
*   Amount of this task's internal memory which is held by the compressor.
*   Such memory is no longer actually resident for the task [i.e., resident in its pmap],
*   and could be either decompressed back into memory, or paged out to storage, depending
*   on our implementation.
*
* iokit_mapped
*   IOKit mappings: The total size of all IOKit mappings in this task, regardless of
    clean/dirty or internal/external state].
*
* alternate_accounting
*   The number of internal dirty pages which are part of IOKit mappings. By definition, these pages
*   are counted in both internal *and* iokit_mapped, so we must subtract them from the total to avoid
*   double counting.
*/
App消耗的实际物理内存,包括:
- Dirty Memory
- Clean memory but loaded in pysical memory
- Page Table
- Compressed Memory
- IOKit used
- NSCache, Purgeable等
获取App的Footprint:
- (int64_t)memoryPhysFootprint {
    task_vm_info_data_t vmInfo;
    mach_msg_type_number_t count = TASK_VM_INFO_COUNT;
    kern_return_t ret = task_info(mach_task_self(), TASK_VM_INFO, (task_info_t)&vmInfo, &count);
    if (ret != KERN_SUCCESS) {
        return 0;
    }
    return vmInfo.phys_footprint;
}
XNU中Jetsam判断内存过大,使用的也是phys_footprint,而非resident size。
获取设备的所有物理内存大小,可以使用
[NSProcessInfo processInfo].physicalMemory
内存测量结果
测量环境
iPhone 7, iOS 13.3。
Clean Memory
初始状态
| 类型 | 内存值(MB) | 分析 |
|---|---|---|
| resident | 59 | App消耗的内存 |
| footprint | 13 | 实际物理内存 |
| VM | 4770 | App分配的虚拟内存 |
| Xcode Navigator | 14.3 | footprint + 调试需要 |
加50MB的clean memory
代码为:
__unused char *buf = malloc(50 * 1024 * 1024);
| 类型 | 内存值(MB) | 增量 | 分析 |
|---|---|---|---|
| resident | 60 | +1 | App消耗的内存 |
| footprint | 14 | +1 | 实际物理内存 |
| VM | 4817 | +47 | App分配的虚拟内存 |
| Xcode Navigator | 14.3 | +0 | footprint + 调试需要 |
实际,仅增加50MB的VM,而这里额外会有1~2MB的footprint增加,猜测是用于内存映射所需的。
到达虚拟内存上限会报错: error: can't allocate region,但不会导致崩溃***。
同时,申请的过程不会耗时。
再加50MB的clean memory
| 类型 | 内存值(MB) | 增量 | 分析 |
|---|---|---|---|
| resident | 60 | +0 | App消耗的内存 |
| footprint | 14 | +0 | 实际物理内存 |
| VM | 4868 | +51 | App分配的虚拟内存 |
| Xcode Navigator | 14.3 | +0 | footprint + 调试需要 |
Dirty Memory
Resident、footprint、VM都增加。是实实在在的内存消耗,各个工具都会统计。
初始状态
| 类型 | 内存值(MB) | 分析 |
|---|---|---|
| resident | 59 | App消耗的内存 |
| footprint | 13 | 实际物理内存 |
| VM | 4769 | App分配的虚拟内存 |
| Xcode Navigator | 14.3 | footprint + 调试需要 |
加50MB的dirty memory
代码为:
// 仅此一句,依然是仅申请虚拟内存,物理内存不会变
char *buf = malloc(50 * 1024 * 1024 * sizeof(char));

// 内存使用了,所以是实际的物理内存被使用了。即内存有数据了,变成dirty memory。
for (int i = 0; i < 50 * 1024 * 1024; i++) {
    buf[i] = (char)rand();
}
| 类型 | 内存值(MB) | 增量 | 分析 |
|---|---|---|---|
| resident | 110 | +51 | App消耗的内存 |
| footprint | 64 | +51 | 实际物理内存 |
| VM | 4817 | +48 | App分配的虚拟内存 |
| Xcode Navigator | 64.4 | +50.1 | footprint + 调试需要 |
实际增加了50MB的物理内存,Resident Memory也会变化,同时额外多了1~2MB。
申请过程比较耗时,超出上限会导致崩溃。
但该操作仅在debug下生效,release环境不生效,应该是iOS系统自行的优化。
再加50MB的dirty memory
| 类型 | 内存值(MB) | 增量 | 分析 |
|---|---|---|---|
| resident | 160 | +50 | App消耗的内存 |
| footprint | 114 | +50 | 实际物理内存 |
| VM | 4868 | +51 | App分配的虚拟内存 |
| Xcode Navigator | 114.4 | +50 | footprint + 调试需要 |
Clean Memory + Dirty Memory
初始状态
| 类型 | 内存值(MB) | 分析 |
|---|---|---|
| resident | 59 | App消耗的内存 |
| footprint | 13 | 实际物理内存 |
| VM | 4770 | App分配的虚拟内存 |
| Xcode Navigator | 14.3 | footprint + 调试需要 |
加50MB的clean memory,使用其中10MB
代码为:
// 申请50MB的虚拟内存
char *buf = malloc(50 * 1024 * 1024 * sizeof(char));

// 实际只用了10MB,所以10MB的dirty memory
for (int i = 0; i < 10 * 1024 * 1024; i++) {
    buf[i] = (char)rand();
}
| 类型 | 内存值(MB) | 增量 | 分析 |
|---|---|---|---|
| resident | 70 | +11 | App消耗的内存 |
| footprint | 24 | +11 | 实际物理内存 |
| VM | 4817 | +47 | App分配的虚拟内存 |
| Xcode Navigator | 24.3 | +10 | footprint + 调试需要 |
申请了50MB,但实际仅使用了10MB,因此只有这10MB为Dirty Memory。
再加50MB的clean memory,使用其中10MB
| 类型 | 内存值(MB) | 增量 | 分析 |
|---|---|---|---|
| resident | 80 | +10 | App消耗的内存 |
| footprint | 34 | +10 | 实际物理内存 |
| VM | 4868 | +51 | App分配的虚拟内存 |
| Xcode Navigator | 34.3 | +10 | footprint + 调试需要 |
VM
初始状态
| 类型 | 内存值(MB) | 分析 |
|---|---|---|
| resident | 59 | App消耗的内存 |
| footprint | 13 | 实际物理内存 |
| VM | 4770 | App分配的虚拟内存 |
| Xcode Navigator | 14.3 | footprint + 调试需要 |
加100MB的VM
代码为:
vm_address_t address;
vm_size_t size = 100*1024*1024;
// VM Tracker中显示Memory Tag 200
vm_allocate((vm_map_t)mach_task_self(), &address, size, VM_MAKE_TAG(200) | VM_FLAGS_ANYWHERE);
// VM Tracker中显示VM_MEMORY_MALLOC_HUGE
// vm_allocate((vm_map_t)mach_task_self(), &address, size, VM_MAKE_TAG(VM_MEMORY_MALLOC_HUGE) | VM_FLAGS_ANYWHERE);
| 类型 | 内存值(MB) | 增量 | 分析 |
|---|---|---|---|
| resident | 60 | +1 | App消耗的内存 |
| footprint | 14 | +1 | 实际物理内存 |
| VM | 4867 | +97 | App分配的虚拟内存 |
| Xcode Navigator | 14.3 | +0 | footprint + 调试需要 |
这里,mach_task_self()表示在自己的进程空间内申请,size的单位是byte。使用参数VM_MAKE_TAG(200)给申请的内存提供一个Tag标记,该数字在VM Tracker中会有标记。
再加100MB的VM
| 类型 | 内存值(MB) | 增量 | 分析 |
|---|---|---|---|
| resident | 60 | +0 | App消耗的内存 |
| footprint | 14 | +0 | 实际物理内存 |
| VM | 4967 | +100 | App分配的虚拟内存 |
| Xcode Navigator | 14.3 | +0 | footprint + 调试需要 |
UIImage
图片大小:map.jpg: 9054*5945
初始状态
| 类型 | 内存值(MB) | 分析 |
|---|---|---|
| resident | 60 | App消耗的内存 |
| footprint | 14 | 实际物理内存 |
| VM | 4768 | App分配的虚拟内存 |
| Xcode Navigator | 14.3 | footprint + 调试需要 |
self.image = [UIImage imageNamed:@"map.jpg"]
| 类型 | 内存值(MB) | 增量 | 分析 |
|---|---|---|---|
| resident | 61 | +2 | App消耗的内存 |
| footprint | 14 | +0 | 实际物理内存 |
| VM | 4768 | +0 | App分配的虚拟内存 |
| Xcode Navigator | 14.4 | +0.1 | footprint + 调试需要 |
构建UIImage对象所需要的图片数据消耗其实不大。这里的数据指的是压缩的格式化数据。
self.imageView.image = self.image;
| 类型 | 内存值(MB) | 增量 | 分析 |
|---|---|---|---|
| resident | 61 | +0 | App消耗的内存 |
| footprint | 92 | +78 | 实际物理内存 |
| VM | 4845 | +77 | App分配的虚拟内存 |
| Xcode Navigator | 92 | +77.6 | footprint + 调试需要 |
这个阶段,需要将图片数据解码成像素数据bitmap,并渲染到屏幕上。解码过程非常消耗内存和CPU资源,且默认在主线程中执行会阻塞主线程。
关于这里的一些详细信息及优化(如异步解码图片数据,主线程渲染),请看后文。
结论
通过以上的比较,可以对各个内存类型有一个初步直观的认识。
- footprint是App实际消耗的物理内存
- resident是实际映射到虚拟内存的物理内存
- 通常看到的Xcode Navigator显示的最接近footprint,另外还有一些调试需要的内存。
几种内存查看方式的区别
Xcode Navigator
初略展示了真实的物理内存消耗。颜色表明了内存占用是否合理。Xcode Navigator = footprint + 调试需要。不跟踪VM。往往初略观察App的内存占用情况,不能作为精确的参考。
Instuments Allocations
这里显示的内存,其实只是整个App占用内存的一部分,即开发者自行分配的内存,如各种类实例等。简单而言,就是开发者自行malloc申请的。
- 主要是MALLOC_XXX, VM Region, 以及部分App进程创建的VM Region。
- 非动态的内存,及部分其他动态库创建的VM Region并不在Allocations的统计范围内。
- 主程序或动态库的_DATA数据段、Stack函数栈,并非通过malloc分配,因此不在Allocations统计内。
All Heap Allocations
- malloc
- CFData
- 其他手动申请的内存,如 *char buf = malloc(50 * 1024 * 1024 * sizeof(char));
Malloc
开发者手动分配的内存块,比如一些人脸检测模型等,还有一些C/C++代码中的。
All Anonymous VM
无法由开发者直接控制,一般由系统接口调用申请的。例如图片之类的大内存,属于All Anonymous VM -> VM: ImageIO_IOSurface_Data,其他的还有IOAccelerator与IOSurface等跟GPU关系比较密切的.
VM: IOAccelerator
CVPixelBuffer: An image buffer that holds pixels in main memory.
A Core Video pixel buffer is an image buffer that holds pixels in main memory. Applications generating frames, compressing or decompressing video, or using Core Image can all make use of Core Video pixel buffers.
主要是CVPixelBuffer,通常使用Pool来管理,交给系统自动释放。而释放的时机完全由系统决定,开发者无法控制。
如果不太需要复用的话,可以考虑改为直接使用create函数,不再复用。这样能保证及时释放掉。
VM: IOSurface
IOSurface是用于存储FBO、RBO等渲染数据的底层数据结构,是跨进程的,通常在CoreGraphics、OpenGLES、Metal之间传递纹理数据。该结构和硬件相关。提供CPU访问VRAM的方式,如创建IOSurface对象后,在CPU往对象里塞纹理数据,GPU就可以直接使用该纹理了。可以简单理解为IOSurface,为CPU和GPU直接搭建了一个传递纹理数据的桥梁。
Share hardware-accelerated buffer data (framebuffers and textures) across multiple processes. Manage image memory more efficiently.
The IOSurface framework provides a framebuffer object suitable for sharing across process boundaries. It is commonly used to allow applications to move complex image decompression and draw logic into a separate process to enhance security.
以下内容参考自:iOS 内存管理研究,总结得非常到位了。
(CGImage是一个可以惰性初始化(持有原始压缩格式DataBuffer),并且通过类似引用计数管理真正的Image Bitmap Buffer的设计,
只有渲染时通过RetainBytePtr拿到Bitmap Buffer塞给VRAM(IOSurface),不渲染时ReleaseBytePtr释放Bitmap Buffer,DataBuffer占用本身就小)。
通常我们使用UIImageView,系统会自动处理解码过程,在主线程上解码和渲染,会占用CPU,容易引起卡顿。
推荐使用ImageIO在后台线程执行图片的解码操作(可参考SDWebImageCoder)。但是ImageIO不支持webp。

ASDK的原理:拿空间换时间,换取流畅,牺牲内存,但内存开销比UIKit高。
	正常用一个全屏的UIImageView,直接用image = UIImage(named:xxx)来设置图片,要在主线程解码,但消耗内存反而较小,只有4MB(正常需要10MB)。
	应该是IOSurface对图片数据做了一些优化。但如果是非常大的图片就会阻塞,不建议直接渲染。
	CGImage是一个可以惰性初始化(持有原始压缩格式DataBuffer),并且通过类似ARC管理真正的Image Bitmap Buffer的设计。
	只有渲染时候通过RatainBytePtr拿到Bitmap Buffer塞给VRAM(IOSurface),不渲染时ReleaseBytePtr释放Bitmap Buffer,DataBuffer本身占用很小。
VM: Stack
调用堆栈,一般不需要做啥。每个线程都需要500KB左右的栈空间,主线程1MB。
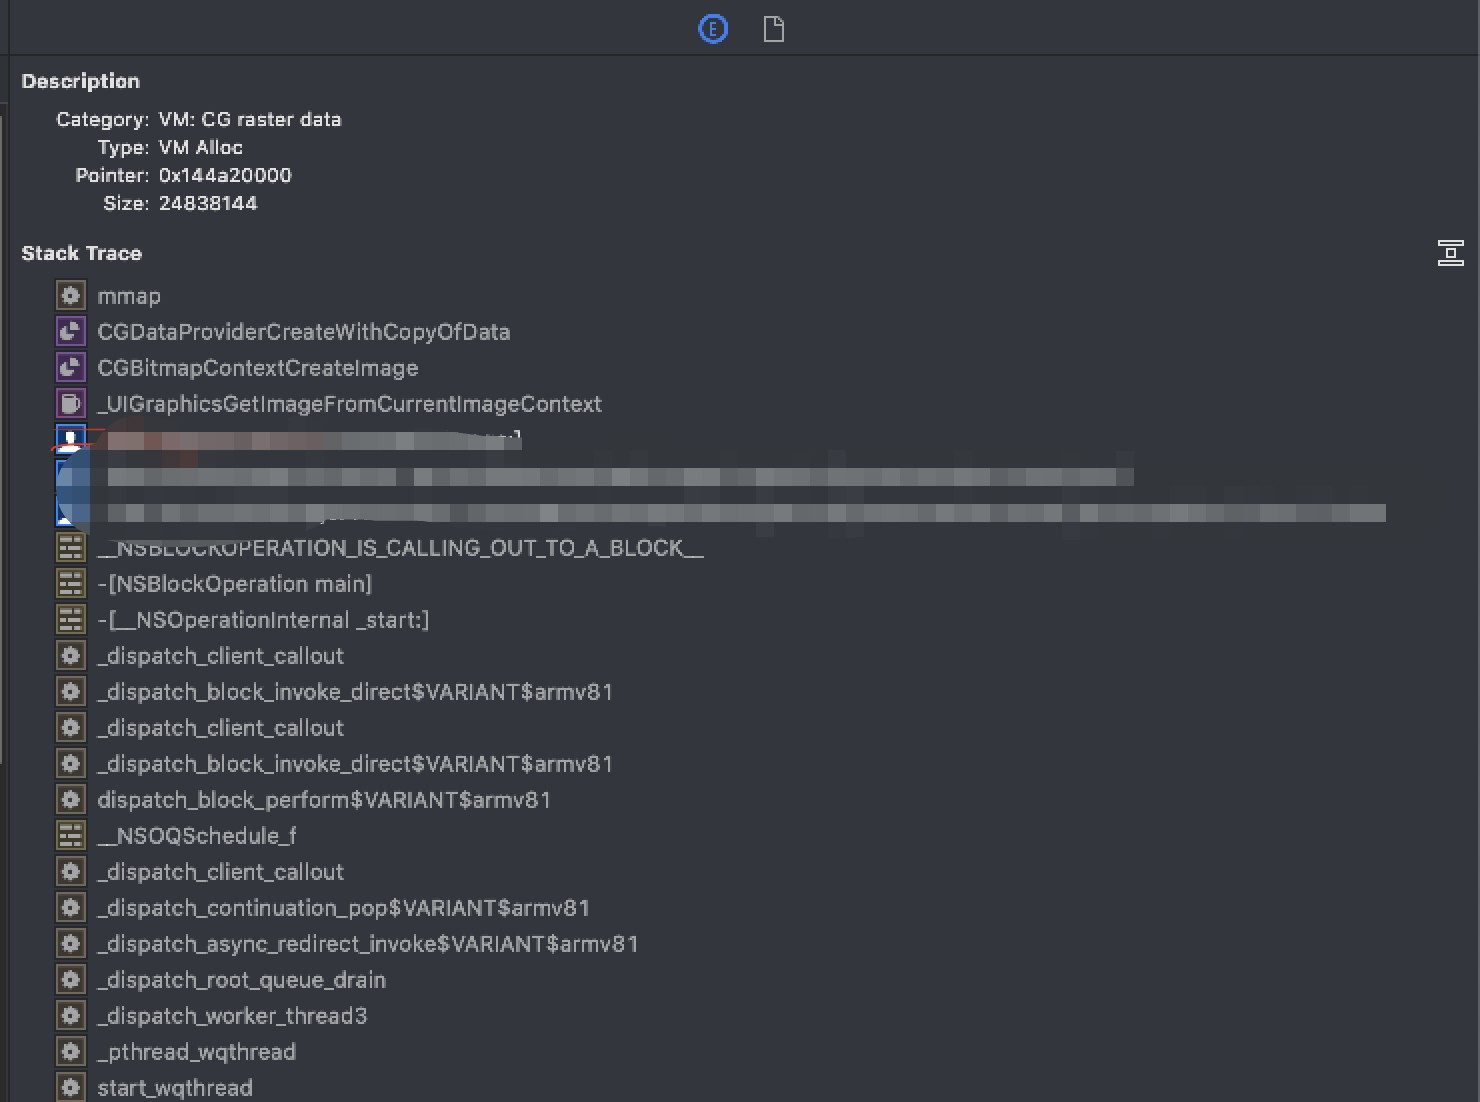
VM: CG raster data
SDWebImage的图片解码数据的缓存,为了避免渲染时在主线程解码导致阻塞。如果对于这一点比较介意,可以做相应设置即可:
/// Decompressing images that are downloaded and cached can improve peformance but can consume lot of memory.
/// Defaults to YES. Set this to NO if you are experiencing a crash due to excessive memory consumption.
[[SDImageCache sharedImageCache] setShouldDecompressImages:NO];
[[SDWebImageDownloader sharedDownloader] setShouldDecompressImages:NO];
[[SDImageCache sharedImageCache] setShouldCacheImagesInMemory:NO];
常见堆栈:
mmap
CGDataProvicerCreateWithCopyOfData
CGBitmapContextCreateImage
[SDWebImageWebPCoder decodedImageWithData:]
[SDWebImageCodersManager decodedImageWithData:]
[SDImageCache diskImageForKey:data:options:]
[SDImageCache queryCacheOperationForKey:options:done:]_block_invoke
Instuments VM Tracker
interesting VM regions such as graphics- and Core Data-related. Hides mapped files, dylibs, and some large reserved VM regions.
比较大块的内存占用,如WebKit、ImageIO、CoreAnimation等VM Region,一般由系统生成和管理。
- 数据段_DATA,如占用VM为10.6MB,Resident为6261KB,Dirty为1930KB。
- 数据段_DATA_CONST,每个framework都有,当App在运行时用到了该framework,则此段内存由clean变为dirty。如占用VM为33.9MB,Resident为31.5MB,Dirty为4466KB。
- 数据段_DATA_DIRTY,每个framework都有_DATA段和_DATA_DIRTY段,内存是dirty的。如占用VM为862KB,Resident为798KB,Dirty为451KB。
- 有_LINKEDIT,包含了方法和变量的元数据(位置、偏移量),及代码签名等信息。如占用VM为98MB,Resident为22.4MB,Dirty为0KB. 注意:Dirty为0.
- 代码段_TEXT,如占用VM为252.9MB,Resident为133.7MB,Dirty为80KB。 注意:Dirty几乎为0.
- mapped file,如占用VM为104.4MB,Resident为7472KB,Dirty为32KB。clean memory。
- shared memory,如占用VM为64KB,Resident为64KB,Dirty为64KB。
- unused but dirty shlib __DATA,如占用VM为721KB,Resident为721KB,Dirty为721KB。
其他比如MALLOC_LARGE,MALLOC_NANO等都是申请VM的时候设置的tag。
- MALLOC_LARGE, 如占用VM为384KB,Resident为384KB,Dirty为384KB。
- MALLOC_NANO, 如占用VM为512MB,Resident为1584KB,Dirty为1568KB。
- MALLOC_SMALL, 如占用VM为24MB,Resident为896KB,Dirty为800KB。
- MALLOC_TINY, 如占用VM为4096KB,Resident为432KB,Dirty为432KB。
- Stack, 如占用VM为2096KB,Resident为144KB,Dirty为128KB。
- Performance tool data, 调试所需,如占用VM为336KB,Resident为336KB,Dirty为336KB。
分析一个VM Tracker的截图
例如:
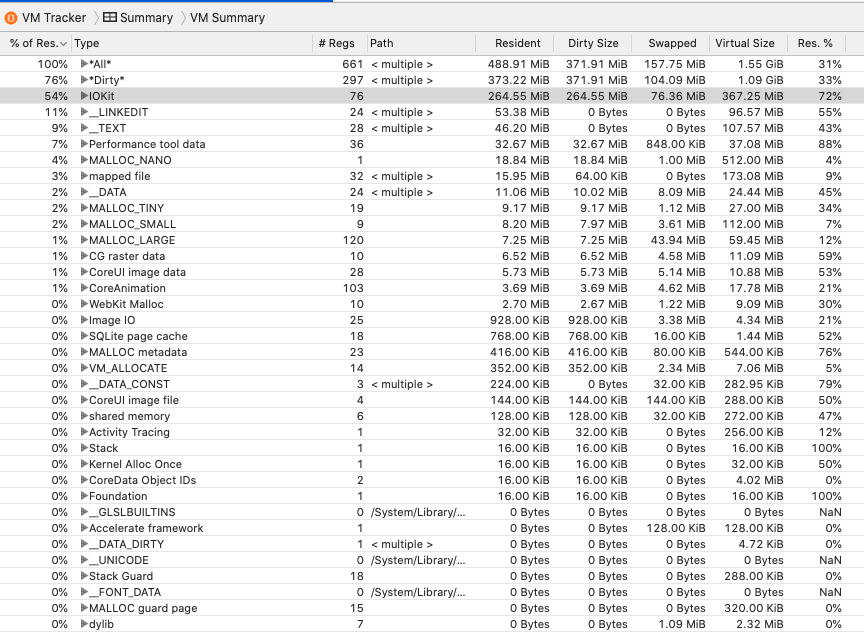
Type All 那一行说明:
- App一共申请了1.55GB的虚拟内存
- App实际使用的虚拟内存(Resident + Swapped = 488.91MB + 157.75MB = 646.66GB)
- iOS Swapped 157.75MB,不懂。其实就是Compressed。
- 实际物理内存Resident Memory为488.91MB
- Resident Memory中一共包含Dirty Memory为371.91MB
VM Tracker中的内存Type
VM_Tracker如何识别出每个内存块的Type?答案即为vm_allocate函数调用时的最后一个参数flags。如MALLOC_TINY, MALLOC_SMALL, MALLOC_LARGE, ImageIO等。 vm_allocate((vm_map_t)mach_task_self(), &address, size, VM_MAKE_TAG(200) | VM_FLAGS_ANYWHERE); VM_FLAGS_ANYWHERE是flags中控制内存分配方式的flag,表示可以接受任意位置。
#define VM_FLAGS_FIXED          0x0000
#define VM_FLAGS_ANYWHERE       0x0001
#define VM_FLAGS_PURGABLE       0x0002
#define VM_FLAGS_4GB_CHUNK      0x0004
#define VM_FLAGS_RANDOM_ADDR    0x0008
#define VM_FLAGS_NO_CACHE       0x0010
#define VM_FLAGS_RESILIENT_CODESIGN     0x0020
#define VM_FLAGS_RESILIENT_MEDIA        0x0040
#define VM_FLAGS_OVERWRITE      0x4000  /* delete any existing mappings first */
即 2个字节就可存储该flag,而int4个字节的剩下两个就可用于存储标记内存类型的Type了。
VM_MAKE_TAG可快速设置Type。
#define VM_MAKE_TAG(tag) ((tag) << 24)
将值左移24个bit,即3个字节,则一个字节表示内存类型。

苹果内置的Type有:
#define VM_MEMORY_MALLOC 1
#define VM_MEMORY_MALLOC_SMALL 2
#define VM_MEMORY_MALLOC_LARGE 3
#define VM_MEMORY_MALLOC_HUGE 4
#define VM_MEMORY_SBRK 5// uninteresting -- no one should call
#define VM_MEMORY_REALLOC 6
#define VM_MEMORY_MALLOC_TINY 7
#define VM_MEMORY_MALLOC_LARGE_REUSABLE 8
#define VM_MEMORY_MALLOC_LARGE_REUSED 9
所以,这个地方的Type即为VM Tracker中显示的Type。
而设置自己的数字也是为了快速定位到自己的虚拟内存。
Xcode Memory Debugger
该工具可以非常方便地查看所有对象的内存使用情况、依赖关系,以及循环引用等。如果将其导出为memgraph文件,也可以使用一些命令来进行分析:
vmmap
vmmap memory-info.memgraph
# 查看摘要
vmmap --summary memory-info.memgraph
结合shell中的grep、awk等命令,可以获得任何想要的内存数据。
# 查看所有dylib的Dirty Pages的总和
vmmap -pages memory-info.memgraph | grep '.dylib' | awk '{sum += $6} END { print "Total Dirty Pages:"sum}'
# 查看CG image相关的内存数据
vmmap memory-info.memgraph | grep 'CG image'
heap
查看堆内存
# 查看Heap上的所有对象
heap memory-info.memgraph
# 按照内存大小来排序
heap memory-info.memgraph -sortBySize
# 查看某个类的所有实例对象的内存地址
heap memory-info.memgraph -addresses all | 'MyDataObject'
leaks
# 查看是否有内存泄漏
leaks memory-info.memgraph
# 查看内存地址处的泄漏情况
leaks --traceTree [内存地址] memory-info.memgraph
malloc_history
需要开启Run->Diagnostics中的Malloc Stack功能,建议使用Live Allocations Only。则lldb会记录debug过程中的对象创建的堆栈,配合malloc_history,即可定位对象的创建过程。
malloc_history memory-info.memgraph [address]
malloc_history memory-info.memgraph --fullStacks [address]
自定义内存统计工具
内存分配的源码探究
通过学习libmalloc的源码,可以知道,我们通常都使用malloc来申请内存,其本质就是从vmpage映射获取内存。
malloc有一系列相关方法,calloc,ralloc,valloc,malloc_zone_malloc,malloc_zone_calloc, malloc_zone_valloc, malloc_zone_realloc, malloc_zone_batch_malloc等。大内存的分配都是通过scalable_zone进行分配。
在libmalloc/src/malloc.c中:
/*********	Generic ANSI callouts	************/

void *
malloc(size_t size)
{
	void *retval;
	retval = malloc_zone_malloc(default_zone, size);
	if (retval == NULL) {
		errno = ENOMEM;
	}
	return retval;
}

void *
calloc(size_t num_items, size_t size)
{
	void *retval;
	retval = malloc_zone_calloc(default_zone, num_items, size);
	if (retval == NULL) {
		errno = ENOMEM;
	}
	return retval;
}

void
free(void *ptr)
{
	malloc_zone_t *zone;
	size_t size;
	if (!ptr) {
		return;
	}

	zone = find_registered_zone(ptr, &size);
	if (!zone) {
		int flags = MALLOC_REPORT_DEBUG | MALLOC_REPORT_NOLOG;
		if ((malloc_debug_flags & (MALLOC_ABORT_ON_CORRUPTION | MALLOC_ABORT_ON_ERROR))) {
			flags = MALLOC_REPORT_CRASH | MALLOC_REPORT_NOLOG;
		}
		malloc_report(flags,
				"*** error for object %p: pointer being freed was not allocated\n", ptr);
	} else if (zone->version >= 6 && zone->free_definite_size) {
		malloc_zone_free_definite_size(zone, ptr, size);
	} else {
		malloc_zone_free(zone, ptr);
	}
}

void *
realloc(void *in_ptr, size_t new_size)
{
	void *retval = NULL;
	void *old_ptr;
	malloc_zone_t *zone;

	// SUSv3: "If size is 0 and ptr is not a null pointer, the object
	// pointed to is freed. If the space cannot be allocated, the object
	// shall remain unchanged."  Also "If size is 0, either a null pointer
	// or a unique pointer that can be successfully passed to free() shall
	// be returned."  We choose to allocate a minimum size object by calling
	// malloc_zone_malloc with zero size, which matches "If ptr is a null
	// pointer, realloc() shall be equivalent to malloc() for the specified
	// size."  So we only free the original memory if the allocation succeeds.
	old_ptr = (new_size == 0) ? NULL : in_ptr;
	if (!old_ptr) {
		retval = malloc_zone_malloc(default_zone, new_size);
	} else {
		zone = find_registered_zone(old_ptr, NULL);
		if (!zone) {
			int flags = MALLOC_REPORT_DEBUG | MALLOC_REPORT_NOLOG;
			if (malloc_debug_flags & (MALLOC_ABORT_ON_CORRUPTION | MALLOC_ABORT_ON_ERROR)) {
				flags = MALLOC_REPORT_CRASH | MALLOC_REPORT_NOLOG;
			}
			malloc_report(flags, "*** error for object %p: pointer being realloc'd was not allocated\n", in_ptr);
		} else {
			retval = malloc_zone_realloc(zone, old_ptr, new_size);
		}
	}

	if (retval == NULL) {
		errno = ENOMEM;
	} else if (new_size == 0) {
		free(in_ptr);
	}
	return retval;
}

void *
valloc(size_t size)
{
	void *retval;
	malloc_zone_t *zone = default_zone;
	retval = malloc_zone_valloc(zone, size);
	if (retval == NULL) {
		errno = ENOMEM;
	}
	return retval;
}

extern void
vfree(void *ptr)
{
	free(ptr);
}
类似malloc_zone_malloc的函数,会真正执行内存分配的操作,注意其中的malloc_logger,系统会有默认的malloc_logger函数对内存分配情况进行记录。
void *
malloc_zone_malloc(malloc_zone_t *zone, size_t size)
{
	MALLOC_TRACE(TRACE_malloc | DBG_FUNC_START, (uintptr_t)zone, size, 0, 0);

	void *ptr;
	if (malloc_check_start && (malloc_check_counter++ >= malloc_check_start)) {
		internal_check();
	}
	if (size > MALLOC_ABSOLUTE_MAX_SIZE) {
		return NULL;
	}

	ptr = zone->malloc(zone, size);		// if lite zone is passed in then we still call the lite methods


	if (malloc_logger) {
		malloc_logger(MALLOC_LOG_TYPE_ALLOCATE | MALLOC_LOG_TYPE_HAS_ZONE, (uintptr_t)zone, (uintptr_t)size, 0, (uintptr_t)ptr, 0);
	}

	MALLOC_TRACE(TRACE_malloc | DBG_FUNC_END, (uintptr_t)zone, size, (uintptr_t)ptr, 0);
	return ptr;
}
在malloc_zone_malloc,malloc_zone_calloc,malloc_zone_valloc,malloc_zone_realloc,malloc_zone_free,malloc_zone_free_definite_size,malloc_zone_memalign,malloc_zone_batch_malloc一系列内存相关函数中,都有malloc_logger的使用。
因此,可以通过hook malloc_logger函数来分析内存分配情况。
对malloc_logger函数进行hook
注意:使用fishhook对malloc_logger函数进行hook,然后就可以对内存进行详细的统计了。这个说法是错误的!!!
因malloc_logger本身就是一个函数指针,需要的时候,直接给其传递一个实现即可。iOS系统即有一个默认的实现。
在libmalloc的源码中可以看到:
typedef void(malloc_logger_t)(uint32_t type,
		uintptr_t arg1,
		uintptr_t arg2,
		uintptr_t arg3,
		uintptr_t result,
		uint32_t num_hot_frames_to_skip);

extern malloc_logger_t *__syscall_logger; // use this to set up syscall logging (e.g., vm_allocate, vm_deallocate, mmap, munmap)
// Only setup stack logging hooks once lazy initialization is complete, the
// malloc_zone calls above would otherwise initialize malloc stack logging,
// which calls into malloc re-entrantly from Libc upcalls and so deadlocks
// in the lazy initialization os_once(). rdar://13046853
if (stack_logging_enable_logging) {
	switch (stack_logging_mode) {
	case stack_logging_mode_malloc:
		malloc_logger = __disk_stack_logging_log_stack;
		break;
	case stack_logging_mode_vm:
		__syscall_logger = __disk_stack_logging_log_stack;
		break;
	case stack_logging_mode_all:
		malloc_logger = __disk_stack_logging_log_stack;
		__syscall_logger = __disk_stack_logging_log_stack;
		break;
	case stack_logging_mode_lite:
		__syscall_logger = __disk_stack_logging_log_stack;
		create_and_insert_lite_zone_while_locked();
		enable_stack_logging_lite();
		break;
	case stack_logging_mode_vmlite:
		__syscall_logger = __disk_stack_logging_log_stack;
		break;
	}
}
我们只需要对其传递一个实现函数即可做到hook。同时,注意不要将系统默认的mallc_logger实现覆盖掉了。
typedef void (malloc_logger_t)(uint32_t type, uintptr_t arg1, uintptr_t arg2, uintptr_t arg3, uintptr_t result, uint32_t num_hot_frames_to_skip);
extern malloc_logger_t *malloc_logger;
extern malloc_logger_t *__syscall_logger; // use this to set up syscall logging (e.g., vm_allocate, vm_deallocate, mmap, munmap)

malloc_logger_t *orig_malloc_logger;
void __my_malloc_logger(uint32_t type, uintptr_t arg1, uintptr_t arg2, uintptr_t arg3, uintptr_t result, uint32_t num_hot_frames_to_skip);
void my_malloc_logger(uint32_t type, uintptr_t arg1, uintptr_t arg2, uintptr_t arg3, uintptr_t result, uint32_t num_hot_frames_to_skip)
{
    if (orig_malloc_logger) {
        /// 系统的
        orig_malloc_logger(type, arg1, arg2, arg3, result, num_hot_frames_to_skip);
    }
    /// 添加自己的一些统计等操作。
    __my_malloc_logger(type, arg1, arg2, arg3, result, num_hot_frames_to_skip);
}

void __my_malloc_logger(uint32_t type, uintptr_t arg1, uintptr_t arg2, uintptr_t arg3, uintptr_t result, uint32_t num_hot_frames_to_skip)
{
  // 根据type对内存进行分析。
}
int main(int argc, char * argv[]) {
    /// malloc_logger本身就是一个hook函数,如果需要的话,只给其指定一个实现即可。
    /// 注意:不要影响了系统对其的实现。所以要先保存系统的,然后在自定义的实现中调用系统的。
    if (malloc_logger && malloc_logger != my_malloc_logger) {
        orig_malloc_logger = malloc_logger;
    }
    malloc_logger = (malloc_logger_t *)my_malloc_logger;

    NSString * appDelegateClassName;
    @autoreleasepool {
        // Setup code that might create autoreleased objects goes here.
        appDelegateClassName = NSStringFromClass([AppDelegate class]);
    }
    return UIApplicationMain(argc, argv, nil, appDelegateClassName);
}
对内存的详细分析,可以参考 OOMDetector 以及 MTHawkeye。
几种内存测量方式的使用建议
通常情况下,
- 各个工具展示的内存值可能不一致,因为其统计的方式及包含内存类型不一致。如Xcode Navigator通常只反映内存占用的大概情况,详细信息需要通过Allocations来查看。
- 开发者自行分配的内存在堆(Heap)上,使用Allocations来查看即可。
- 开发者调用iOS系统接口也会导致大量内存分配,需要使用VM Tracker来查看。尤其是一些OpenGL渲染、CoreVideo所需、ImageIO等的大内存。
- 对于内存泄漏等,可以使用Leaks,或Xcode Memory Debugger即可。当然,并非所有的泄漏都能通过这些工具检测出来,有些情况下需要使用MLeaksFinder等,或者自行根据Memory Graph的情况来进行分析。
- Xcode Memory Debugger很强大。如果觉得打开Instruments很麻烦,可以在开发调试过程中将Memory Graph及时导出进行分析。
- 自定义内存统计工具比较考验底层功底,有时间建议深入研究一番,会有不少收获。如性能监控工具中,内存监控、OOM监控等就是必不可少的。
针对内存类型的优化措施
Allocations
主要是开发者自行分配内存的时候要注意。
IOKit
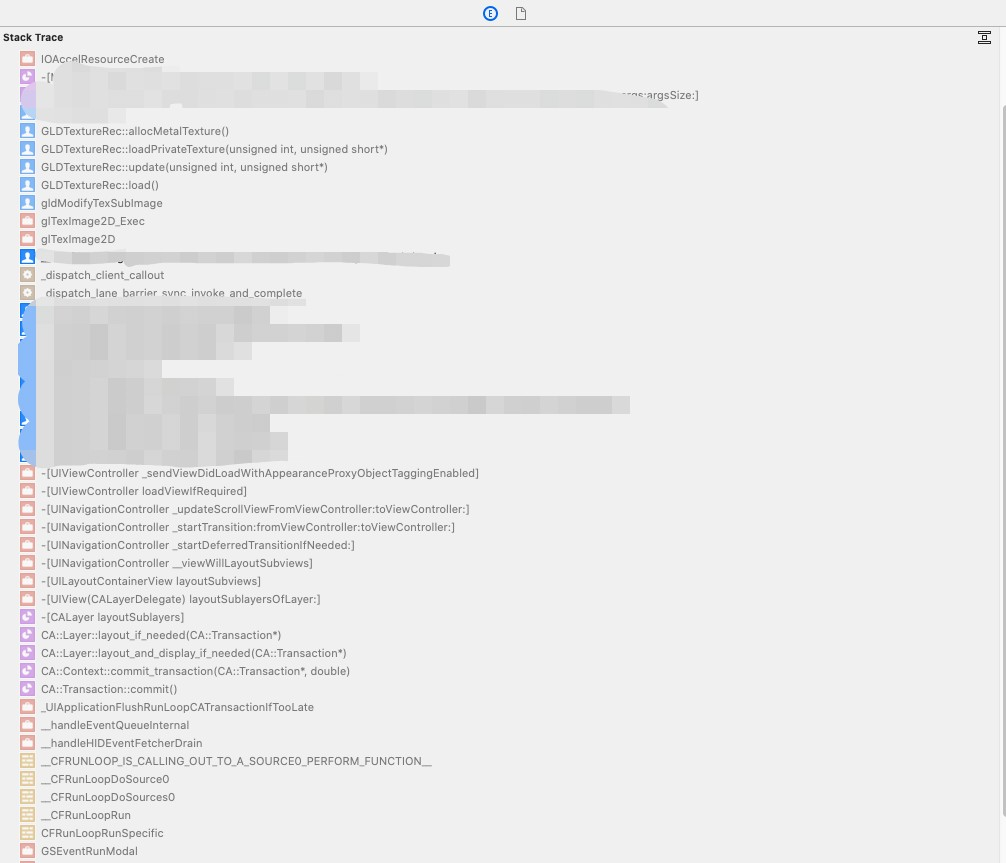
这一部分主要是图片、OpenGL纹理、CVPixelBuffer等,比如通常是OpenGL的纹理,glTexImage2d调用产生的。iOS系统有相关释放接口。但可能释放不及时。
CPU和GPU的都算在VM中。Allocations不包含GL纹理,创建一定数量纹理后,到达极限值,则之后创建纹理就会失败,App可能不会崩溃,但是出现异常,花屏,或者拍后页白屏。
显存可能被映射到某块虚拟内存,因此可以通过IOKit来查看纹理增长情况。手机的显存就是内存,而Mac才区分显存和内存。
纹理是在内核态分配的,不计算到Allocations里边。如包含OpenGL的纹理,是Dirty Size,需要降下来。
若GL分配纹理不释放,则IOKit的Virtual Size不断增长;如果纹理正确释放,则Virtual Size比较稳定。
After some research, I found this post about Finding iOS Memory, which mentions that OpenGL’s textures are shown Dirty memory labelled as IOKit.
Some drivers may keep the storage allocated so that they can reuse it for satisfying future allocations (rather than having to allocate new storage – a common misunderstanding this behaviour leads to is people thinking they have a memory leak), other drivers may not.
所以,通常情况下,开发者已经正确调用了释放内存的操作,但是OpenGL自己做的优化,使得内存并未真正地及时释放掉,仅仅是为了重用。
glDeleteTextures is the standard way to delete texture objects in OpenGL, but note that this isn't like malloc/free - glDeleteTextures only promises that the texture names become available for subsequent reuse, it says nothing about the actual memory used for storage, which will be driver-dependent behaviour.

Some drivers may keep the storage allocated so that they can reuse it for satisfying future allocations (rather than having to allocate new storage - a common misunderstanding this behaviour leads to is people thinking they have a memory leak), other drivers may not.

This is consistent with the API specification for all other GL objects; glGen* to create object names, glBind* to use them, glDelete* to make the names available for reuse. See e.g. glDeleteBuffers for another example.

So, actually releasing the backing storage is not something you need to worry about yourself; drivers will handle this automatically and you can work on the basis that the memory usage pattern is selected by the driver writers using their own knowledge of what's best for the hardware.
glDeleteTextures deletes n textures named by the elements of the array textures. After a texture is deleted, it has no contents or dimensionality, and its name is again unused. If a texture that is currently bound is deleted, the binding reverts to 0 (the default texture).

Unused names in textures that have been marked as used for the purposes of glGenTextures are marked as unused again. glDeleteTextures silently ignores 0's and names that do not correspond to existing textures.
glDeleteTextures函数,并非一定会立即释放掉纹理,而是表明该纹理可以再次在glGenTextures的时候被复用。
[[GPUImageContext sharedFramebufferCache] purgeAllUnassignedFramebuffers];
- (void)purgeAllUnassignedFramebuffers;
{
    runAsynchronouslyOnVideoProcessingQueue(^{
        [framebufferCache removeAllObjects];
        [framebufferTypeCounts removeAllObjects];
#if TARGET_IPHONE_SIMULATOR || TARGET_OS_IPHONE
        CVOpenGLESTextureCacheFlush([[GPUImageContext sharedImageProcessingContext] coreVideoTextureCache], 0);
#else
#endif
    });
}
这里有一点需要格外注意:CVOpenGLESTextureCacheFlush调用后,内存可能依然不会立即释放。假设延迟5s执行,则可能释放(而延迟1s,则可能只释放部分内存)。
这与CVPixelBuffer以及CVOpenGLESTextureCacheFlush的自身机制有关系。
- 如默认情况下纹理会延迟1s进行page out操作;
- CVOpenGLESTextureCacheFlush的方法注释中刻意添加了周期性调用(This call must be made periodically)的提示,以保证纹理释放操作的执行。
//
// cacheAttributes
//
// By default, textures will age out after one second.  Setting a maximum
// texture age of zero will disable the age-out mechanism completely.
// CVOpenGLESTextureCacheFlush() can be used to force eviction in either case.

CV_EXPORT const CFStringRef CV_NONNULL kCVOpenGLESTextureCacheMaximumTextureAgeKey COREVIDEO_GL_DEPRECATED(ios, 5.0, 12.0) COREVIDEO_GL_DEPRECATED(tvos, 9.0, 12.0) API_UNAVAILABLE(macosx) __WATCHOS_PROHIBITED;

/*!
    @function   CVOpenGLESTextureCacheFlush
    @abstract   Performs internal housekeeping/recycling operations
    @discussion This call must be made periodically to give the texture cache a chance to make OpenGLES calls
                on the OpenGLES context used to create it in order to do housekeeping operations.  The EAGLContext
	            associated with the cache may be used to delete or unbind textures.
    @param      textureCache The texture cache object to flush
    @param      options Currently unused, set to 0.
*/
CV_EXPORT void CVOpenGLESTextureCacheFlush( CVOpenGLESTextureCacheRef CV_NONNULL textureCache, CVOptionFlags options ) COREVIDEO_GL_DEPRECATED(ios, 5.0, 12.0) COREVIDEO_GL_DEPRECATED(tvos, 9.0, 12.0) API_UNAVAILABLE(macosx) __WATCHOS_PROHIBITED;
注意,这里的periodically肯定是有坑的。如果遇到内存未立即释放的情况,试一下延迟几秒钟执行CVOpenGLESTextureCacheFlush操作。
CVPixelBuffer
- (void)dealloc {
    if (_pixelBufferPool) {
        CVPixelBufferPoolFlush(_pixelBufferPool, kCVPixelBufferPoolFlushExcessBuffers);
        CVPixelBufferPoolRelease(_pixelBufferPool);
        _pixelBufferPool = nil;
    }
}

- (CVPixelBufferRef)createPixelBufferFromCGImage:(CGImageRef )image {
    size_t height = CGImageGetHeight(image);
    size_t width = CGImageGetWidth(image);
    if (!_pixelBufferPool || !CGSizeEqualToSize(_pixelPoolSize, CGSizeMake(width, height))) {

        if (_pixelBufferPool) {
            CVPixelBufferPoolFlush(_pixelBufferPool, kCVPixelBufferPoolFlushExcessBuffers);
            CVPixelBufferPoolRelease(_pixelBufferPool);
            _pixelBufferPool = nil;
        }

        NSMutableDictionary *attributes = [NSMutableDictionary dictionary];
        [attributes setObject:[NSNumber numberWithInt:kCVPixelFormatType_32BGRA] forKey:(NSString *)kCVPixelBufferPixelFormatTypeKey];
        [attributes setObject:@(width) forKey:(NSString *)kCVPixelBufferWidthKey];
        [attributes setObject:@(height) forKey:(NSString *)kCVPixelBufferHeightKey];
        [attributes setObject:@(32) forKey:(NSString *)kCVPixelBufferBytesPerRowAlignmentKey];
        [attributes setObject:[NSDictionary dictionary] forKey:(NSString *)kCVPixelBufferIOSurfacePropertiesKey];
        CVPixelBufferPoolCreate(kCFAllocatorDefault, NULL, (__bridge CFDictionaryRef _Nullable)(attributes), &_pixelBufferPool);
        _pixelPoolSize = CGSizeMake(width, height);
    }

    CVPixelBufferRef pxbuffer = NULL;
    CVPixelBufferPoolCreatePixelBuffer(kCFAllocatorDefault, _pixelBufferPool,&pxbuffer);
    NSParameterAssert(pxbuffer != NULL);

    CIImage *ciimage = [[CIImage alloc] initWithCGImage:image];

    [_ciContext render:ciimage toCVPixelBuffer:pxbuffer];

    return pxbuffer;
}
如果PixelBuffer重用,则使用Pool,释放操作需要调用Pool的flush函数。而iOS系统中实际的内存释放时机会有延迟,且这里拍照的pixelBuffer并不会频繁复用,因此直接使用create方法来替代Pool更合理。用完就释放。
修改为:
- (CVPixelBufferRef)createPixelBufferFromCGImage:(CGImageRef )image {
    size_t height = CGImageGetHeight(image);
    size_t width = CGImageGetWidth(image);
    CVPixelBufferRef pxbuffer = NULL;

    CFDictionaryRef empty; // empty value for attr value.
    CFMutableDictionaryRef attrs;
    empty = CFDictionaryCreate(kCFAllocatorDefault, NULL, NULL, 0, &kCFTypeDictionaryKeyCallBacks, &kCFTypeDictionaryValueCallBacks); // our empty IOSurface properties dictionary
    attrs = CFDictionaryCreateMutable(kCFAllocatorDefault, 1, &kCFTypeDictionaryKeyCallBacks, &kCFTypeDictionaryValueCallBacks);
    CFDictionarySetValue(attrs, kCVPixelBufferIOSurfacePropertiesKey, empty);
    CVPixelBufferCreate(kCFAllocatorDefault, width, height, kCVPixelFormatType_32BGRA, attrs, &pxbuffer);

    CFRelease(attrs);
    CFRelease(empty);
    NSParameterAssert(pxbuffer != NULL);

    CIImage *ciimage = [[CIImage alloc] initWithCGImage:image];

    [_ciContext render:ciimage toCVPixelBuffer:pxbuffer];

    return pxbuffer;
}
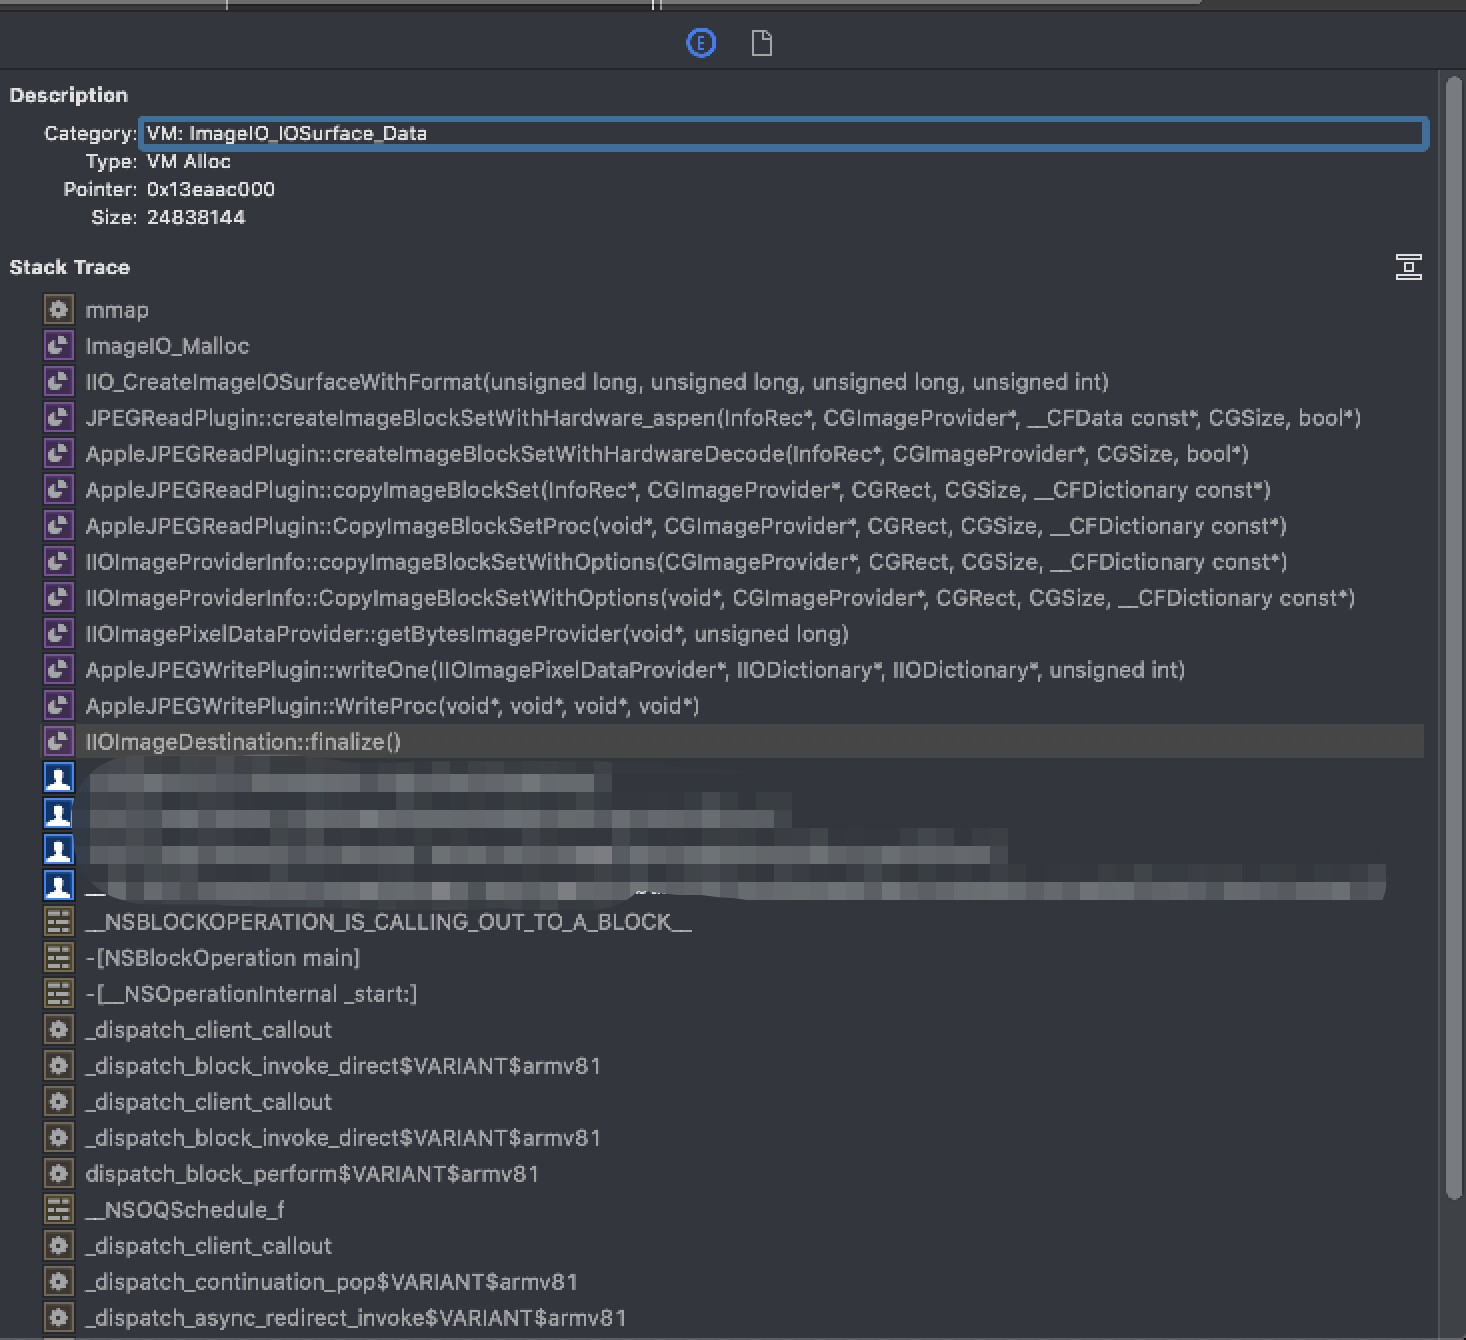
VM:ImageIO_IOSurface_Data
典型堆栈:
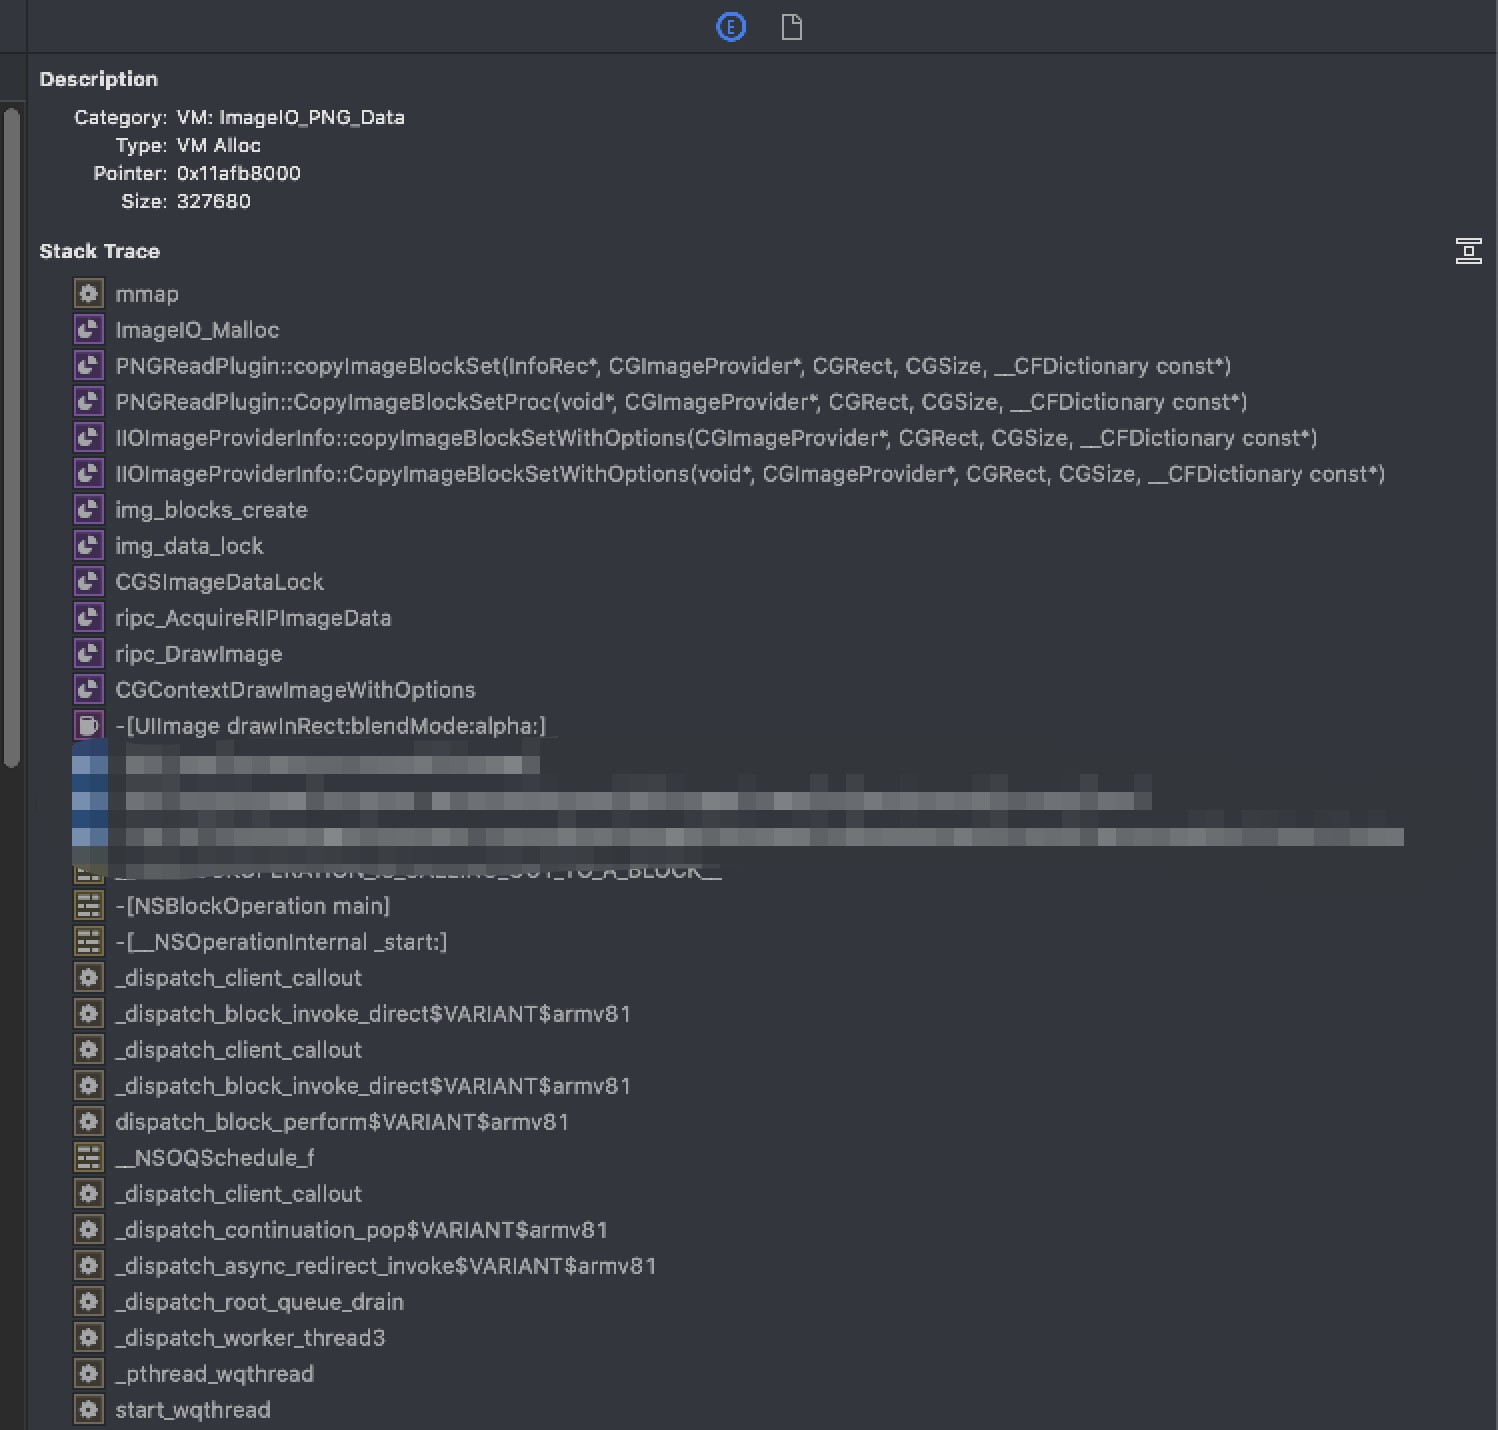
VM:ImageIO_PNG_Data
典型堆栈
UIImage的imageNamed:方法会将图片数据缓存在内存中。而imageWithContentsOfFile:方法则不会进行缓存,用完立即释放掉了。优化建议:
- 对于经常需要使用的小图,可以放到Assets.xcassets中,使用imageNamed:方法。
- 对于不经常使用的大图,不要放到Assets.xcassets中,且使用imageWithContentsOfFile:方法。
如果对于多图的滚动视图,渲染到imageView中后,可以使用autoreleasepool来尽早释放:
for (int i=0;i<10;i++) {
	UIImageView *imageView = xxx;
	NSString *imageFile = xxx;
	@autoreleasepool {
		imageView.image = [UIImage imageWithContentsOfFile:imageFile];
	}
	[self.scrollView addSubview:imageView];
}
优化措施:适当地使用imageNamed:和imageWithContentsOfFile:方法。对于比较老的项目,可以在调试环境对imageNamed:方法进行hook,检测UIImage的size大小,以筛选出尺寸过大的图片。
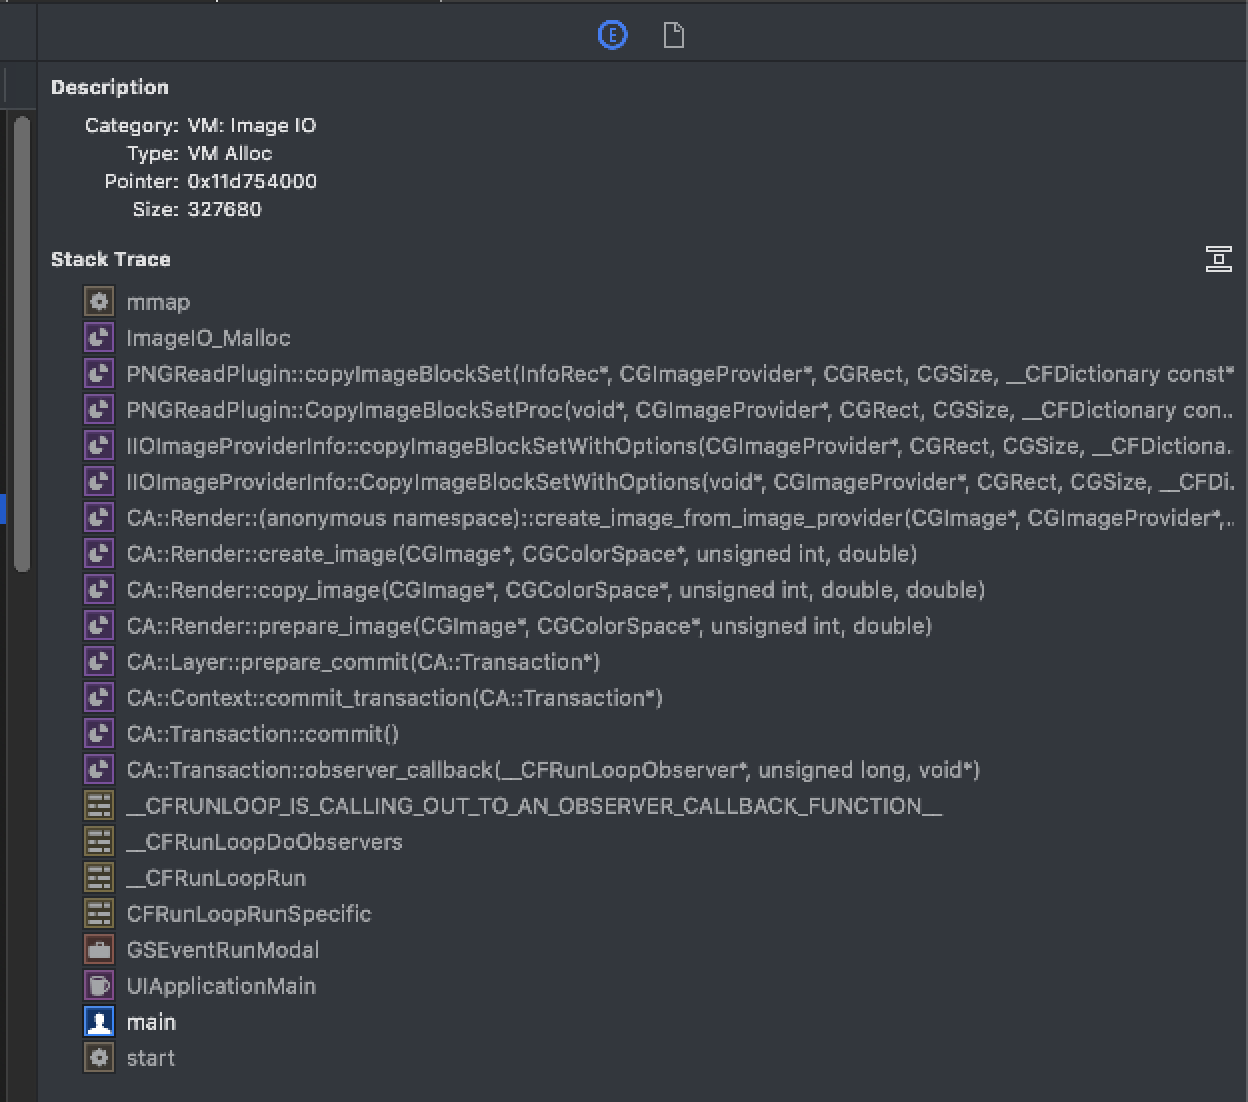
VM:Image IO
典型堆栈:
VM:IOAccelerator
典型堆栈
VM:CG raster data
* Decompressing images that are downloaded and cached can improve peformance but can consume lot of memory.
* Defaults to YES. Set this to NO if you are experiencing a crash due to excessive memory consumption.
光栅数据,即为UIImage的解码数据。SDWebImage将解码数据做了缓存,避免渲染时候在主线程解码而造成阻塞。
优化措施:
[[SDImageCache sharedImageCache] setShouldDecompressImages:NO];
[[SDWebImageDownloader sharedDownloader] setShouldDecompressImages:NO];
[[SDImageCache sharedImageCache] setShouldCacheImagesInMemory:NO];
优化措施:适当地做缓存。
VM:CoreAnimation
一般是UIView,CALayer。如有个5.78MB的,无法看出是哪个View,只知道是一个很大的View。
CA::Render::Shmem::new_bitmap xxxxx
CABackingStorePrepareUpdate_(CABackingStore*,xxxxxxx)
CABackingStoreUpdate_
invocation function  for block in CA::Layer::display_()
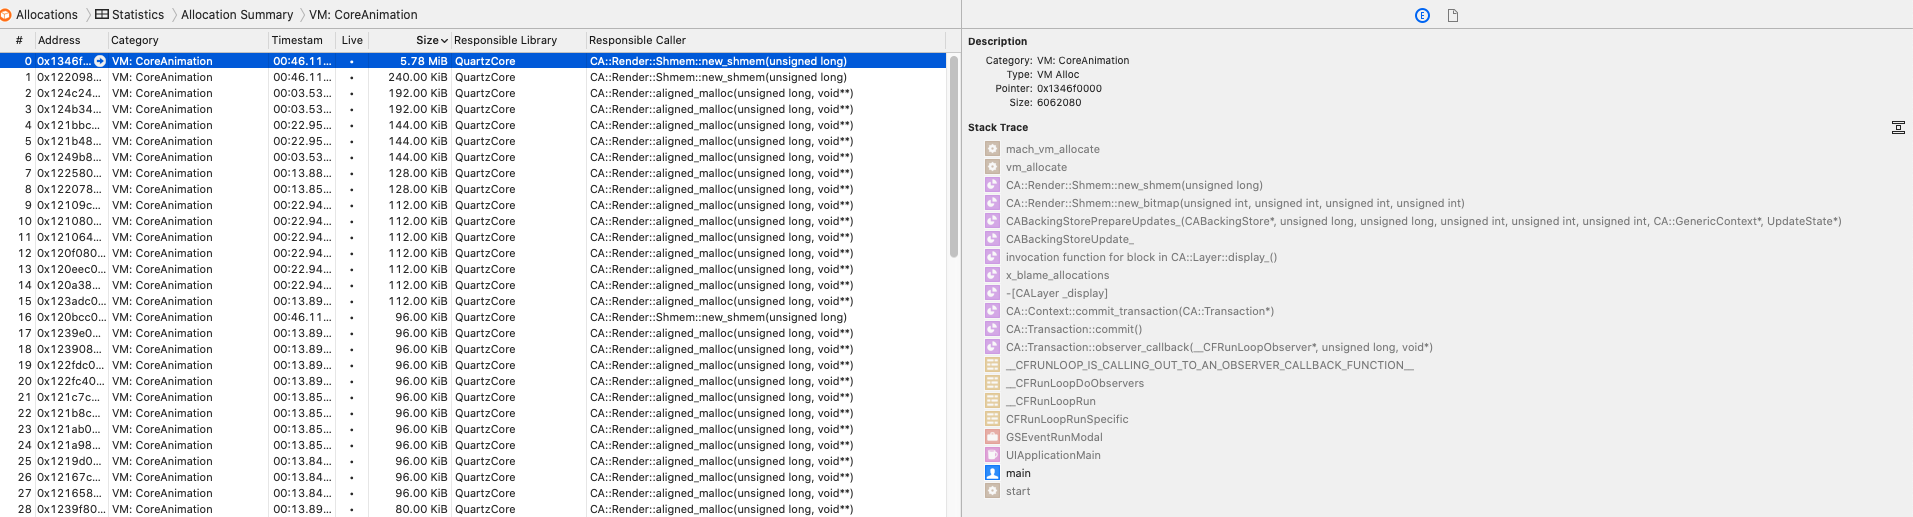
优化措施:不要用太大的UIView和CALayer。
典型堆栈:
mach_vm_allocate
vm_allocate
CA::Render::Shmem::new_shmem
CA::Render::Shmem::new_bitmap
CABackingStorePrepareUpdates_
CABackingStoreUpdate_
invocation function for block in CA::Layer::display_()
x_blame_allocations
[CALayer _display]
CA::Context::commit_transaction
CA::Transaction::commit()
[UIApplication _firstCommitBlock] _block_invoke_2
__CFRUNLOOP_IS_CALLING_OUT_TO_A_BLOCK__
__CFRunLoopDoBlocks
__CFRunLoopRun
CFRunLoopRunSpecific
GSEventRunModal
UIApplicationMain
main
start
VM: CoreUI image data
典型堆栈
mmap
[_CSIRenditionBLockData _allocateImageBytes]
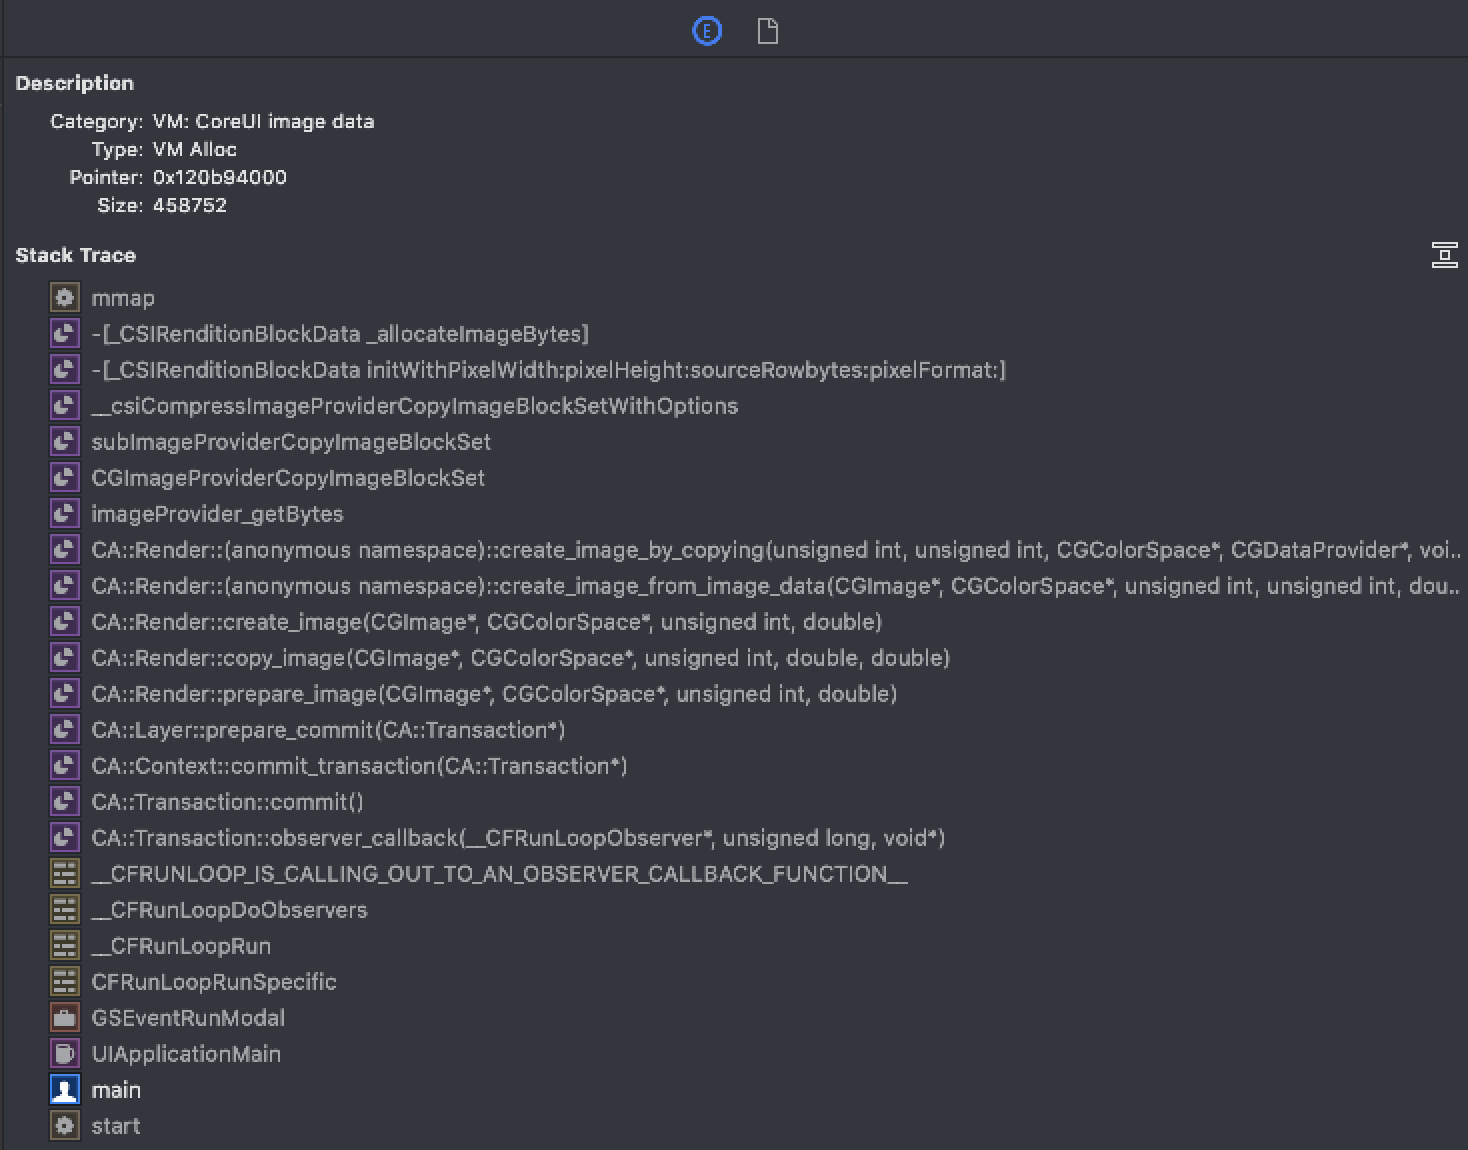
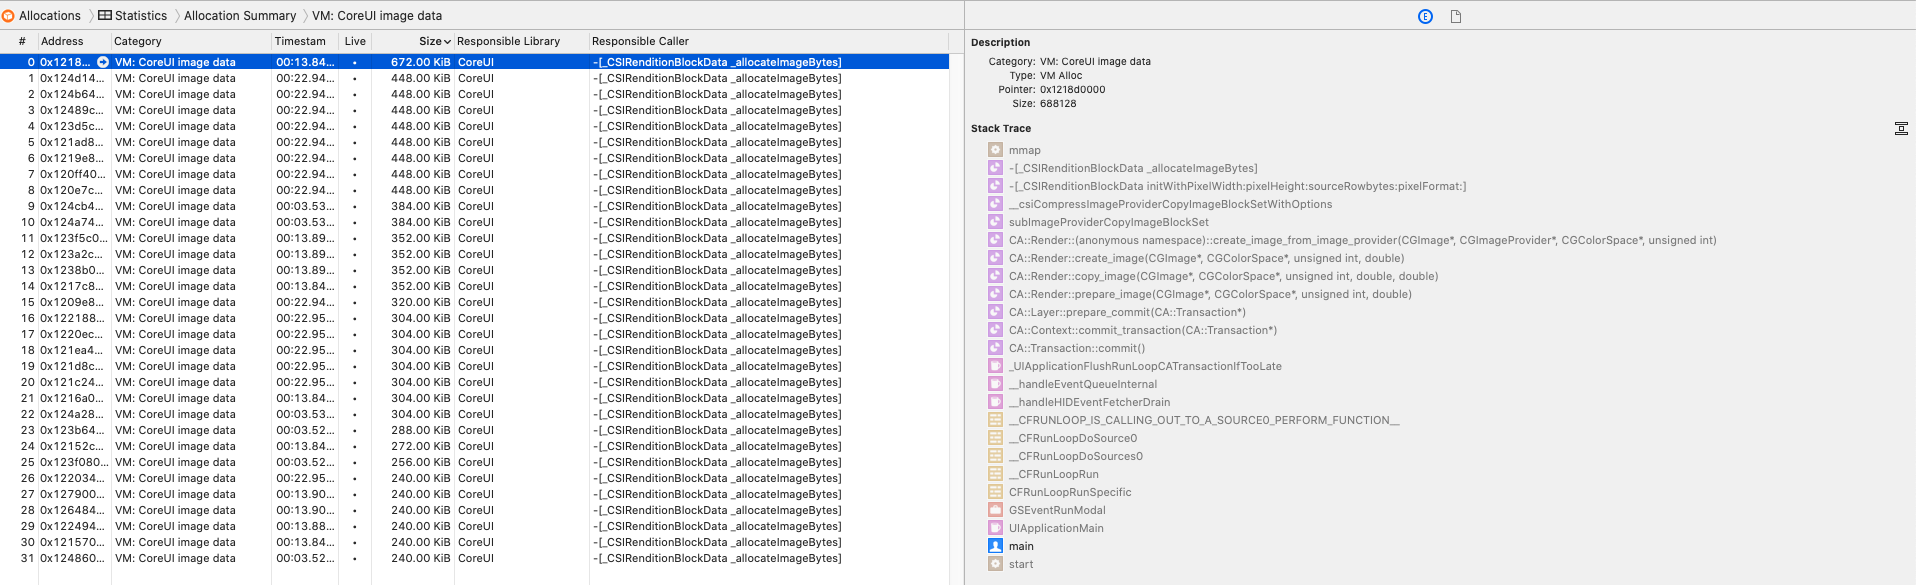
VM_ALLOCATE
这部分基本是对开发者自行分配的大内存进行检查。
代码段__TEXT
优化措施:缩小包体积。
针对使用场景的优化措施
如何计算对象的占用内存大小
将指针传递给malloc_size函数即可获取对象占用的内存size,单位是byte。
malloc_size((__bridge const void *)(object))
图像优化
图片占用的内存大小实际与其分辨率相关的,如果一个像素点占用4个byte的话,width * height * 4 / 1024 / 1024 MB。
参考:WWDC 2018 Session 219:Image and Graphics Best Practices。
imageNamed和imageWithContentsOfFile
- UIImage的imageNamed:方法会将图片数据缓存在内存中,缓存使用的时NSCache,收到内存警告会释放。
- 而imageWithContentsOfFile:方法则不会进行缓存,不需要的时候就立即释放掉了。
所以,
- 对于频繁使用的小图,可以放到Assets.xcassets中,使用imageNamed:方法。
- 对于不经常使用的大图,不要放到Assets.xcassets中,且使用imageWithContentsOfFile:方法。
UIImage的异步解码和渲染
UIImage只有在屏幕上渲染(self.imageView.image = image)的时候,才去解码的,解码操作在主线程执行。所以,如果有非常多(如滑动界面下载大量网络图片)或者较大图片的解码渲染操作,则会阻塞主线程。可以添加异步解码的一些使用技巧。
可以通过如下方式,避免图片使用时候的一些阻塞、资源消耗过大、频繁解码等的情况。
- 异步下载网络图片,进行内存和磁盘缓存
- 对图片进行异步解码,将解码后的数据放到内存缓存
- 主线程进行图片的渲染
可以查看SDWebImage的UIImage的ForceDecode扩展:
/**
 UIImage category about force decode feature (avoid Image/IO's lazy decoding during rendering behavior).
 */
@interface UIImage (ForceDecode)

/**
 Decode the provided image. This is useful if you want to force decode the image before rendering to improve performance.
 @param image The image to be decoded
 @return The decoded image
 */
+ (nullable UIImage *)sd_decodedImageWithImage:(nullable UIImage *)image;

@end
异步解码的详细实现,可以查看SDWebImage的SDImageCoderHelper.m文件:
+ (UIImage *)decodedImageWithImage:(UIImage *)image {
#if SD_MAC
    return image;
#else
    if (![self shouldDecodeImage:image]) {
        return image;
    }

    CGImageRef imageRef = [self CGImageCreateDecoded:image.CGImage];
    if (!imageRef) {
        return image;
    }
    UIImage *decodedImage = [[UIImage alloc] initWithCGImage:imageRef scale:image.scale orientation:image.imageOrientation];
    CGImageRelease(imageRef);
    SDImageCopyAssociatedObject(image, decodedImage);
    decodedImage.sd_isDecoded = YES;
    return decodedImage;
#endif
}

+ (CGImageRef)CGImageCreateDecoded:(CGImageRef)cgImage orientation:(CGImagePropertyOrientation)orientation {
    if (!cgImage) {
        return NULL;
    }
    size_t width = CGImageGetWidth(cgImage);
    size_t height = CGImageGetHeight(cgImage);
    if (width == 0 || height == 0) return NULL;
    size_t newWidth;
    size_t newHeight;
    switch (orientation) {
        case kCGImagePropertyOrientationLeft:
        case kCGImagePropertyOrientationLeftMirrored:
        case kCGImagePropertyOrientationRight:
        case kCGImagePropertyOrientationRightMirrored: {
            // These orientation should swap width & height
            newWidth = height;
            newHeight = width;
        }
            break;
        default: {
            newWidth = width;
            newHeight = height;
        }
            break;
    }

    BOOL hasAlpha = [self CGImageContainsAlpha:cgImage];
    // iOS prefer BGRA8888 (premultiplied) or BGRX8888 bitmapInfo for screen rendering, which is same as `UIGraphicsBeginImageContext()` or `- [CALayer drawInContext:]`
    // Though you can use any supported bitmapInfo (see: https://developer.apple.com/library/content/documentation/GraphicsImaging/Conceptual/drawingwithquartz2d/dq_context/dq_context.html#//apple_ref/doc/uid/TP30001066-CH203-BCIBHHBB ) and let Core Graphics reorder it when you call `CGContextDrawImage`
    // But since our build-in coders use this bitmapInfo, this can have a little performance benefit
    CGBitmapInfo bitmapInfo = kCGBitmapByteOrder32Host;
    bitmapInfo |= hasAlpha ? kCGImageAlphaPremultipliedFirst : kCGImageAlphaNoneSkipFirst;
    CGContextRef context = CGBitmapContextCreate(NULL, newWidth, newHeight, 8, 0, [self colorSpaceGetDeviceRGB], bitmapInfo);
    if (!context) {
        return NULL;
    }

    // Apply transform
    CGAffineTransform transform = SDCGContextTransformFromOrientation(orientation, CGSizeMake(newWidth, newHeight));
    CGContextConcatCTM(context, transform);
    CGContextDrawImage(context, CGRectMake(0, 0, width, height), cgImage); // The rect is bounding box of CGImage, don't swap width & height
    CGImageRef newImageRef = CGBitmapContextCreateImage(context);
    CGContextRelease(context);

    return newImageRef;
}
适当使用autoreleasepool
如果对于多图的滚动视图,渲染到imageView中后,可以使用autoreleasepool来尽早释放:
for (int i=0;i<10;i++) {
	UIImageView *imageView = xxx;
	NSString *imageFile = xxx;
	@autoreleasepool {
		imageView.image = [UIImage imageWithContentsOfFile:imageFile];
	}
	[self.scrollView addSubview:imageView];
}
UIGraphicsImageRenderer
建议使用iOS 10之后的UIGraphicsImageRenderer来执行绘制任务。该API在iOS 12中会根据场景自动选择最合适的渲染格式,更合理地使用内存。
另一个方式,采用UIGraphicsBeginImageContextWithOptions与UIGraphicsGetImageFromCurrentImageContext得到的图片,每个像素点都需要4个byte。可能会有较大内存空间上的浪费。
- (UIImage *)drawImageUsingUIGraphicsImageRenderer {
    CGRect rect = CGRectMake(0, 0, 300, 300);
    UIGraphicsImageRenderer *imageRenderer = [[UIGraphicsImageRenderer alloc] initWithSize:rect.size];
    UIImage *image = [imageRenderer imageWithActions:^(UIGraphicsImageRendererContext * _Nonnull rendererContext) {
        [UIColor.greenColor setFill];
        UIBezierPath *path = [UIBezierPath bezierPathWithRoundedRect:rect
                                                   byRoundingCorners:UIRectCornerAllCorners
                                                         cornerRadii:CGSizeMake(20, 20)];
        [path addClip];
        UIRectFill(rect);
    }];
    return image;
}
UIGraphicsImageRenderer:
A graphics renderer for creating Core Graphics-backed images.
Downsampling
对于一些场景,如UIImageView尺寸较小,而UIImage较大时,直接展示原图,会有不必要的内存和CPU消耗。
之前的方式
将大图缩小的时候,即downsampling的过程,一般需要将原始大图加载到内存,然后做一些坐标空间的转换,再生成小图。此过程中,如果使用UIGraphicsImageRenderer的绘制操作,会消耗比较多的资源。
UIImage *scaledImage = [self scaleImage:image newSize:CGSizeMake(2048, 2048)];

- (UIImage *)scaleImage:(UIImage *)image newSize:(CGSize)newSize {
    // 14.6
    // 这一步只是根据size创建一个bitmap的上下文,参数scale比较关键。
    UIGraphicsBeginImageContextWithOptions(newSize, NO, 1); // 31.5, +16。16MB,2048*2048*4/1024/1024=16
//    UIGraphicsBeginImageContextWithOptions(newSize, NO, 0); // 79.5, +64。64MB,2048*2048*4/1024/1024*2*2=64
    [image drawInRect:CGRectMake(0, 0, newSize.width, newSize.height)]; // 79.7 +0.2MB,最高282.3,+202.6。渲染时的峰值很高。
    UIImage *newImage = UIGraphicsGetImageFromCurrentImageContext(); // 79.7
    UIGraphicsEndImageContext(); // 15.7MB
    return newImage;
}
UIGraphicsBeginImageContextWithOptions:
Creates a bitmap-based graphics context with the specified options.
size:图片缩放的目标尺寸,也就是新的bitmap context的尺寸。
scale:如果传递0,则实际取scale会按照设备的屏幕比例,如2x屏幕就取2倍,如消耗内存2048*2048*4/1024/1024*2*2=64;若scale传递1,则消耗内存2048*2048*4/1024/1024=16。
UIGraphicsBeginImageContextWithOptions需要跟接收参数相关的context消耗,消耗的内存与三个参数相关。其实不大。
关键在于:UIImage的drawInRect:方法在绘制时,会将图片先解码,再生成原始分辨率大小的bitmap,内存峰值可能很高。这一步的内存消耗非常关键,如果图片很大,很容易就会增加几十MB的内存峰值。
这种方式的耗时不多,主要是内存消耗巨大。
推荐的方式
使用ImageIO的接口,避免调用UIImage的drawInRect:方法执行带来的中间bitmap的产生。可以在不产生Dirty Memory的情况下,直接读取图像大小和元数据信息,不会带来额外的内存开销。其内存消耗即为目标尺寸需要的内存。
extension UIImage {
    @objc
    static func downsampling(imageAt imageURL: URL, to pointSize: CGSize, scale: CGFloat) -> UIImage {
        let imageSourceOptions = [kCGImageSourceShouldCache: false] as CFDictionary
        let imageSource = CGImageSourceCreateWithURL(imageURL as CFURL, imageSourceOptions)!

        let maxDimensionInPixels = max(pointSize.width, pointSize.height) * scale
        let downsampleOptions = [
            kCGImageSourceCreateThumbnailFromImageAlways: true,
            kCGImageSourceCreateThumbnailWithTransform: true,
            kCGImageSourceThumbnailMaxPixelSize: maxDimensionInPixels,
            kCGImageSourceShouldCacheImmediately: false
            ] as CFDictionary

        let downsampledImage = CGImageSourceCreateThumbnailAtIndex(imageSource, 0, downsampleOptions)!
        /// Core Foundation objects returned from annotated APIs are automatically memory managed in Swift
        /// you do not need to invoke the CFRetain, CFRelease, or CFAutorelease functions yourself.
        return UIImage(cgImage: downsampledImage)
    }

    @objc
    static func downsampling(imageWith imageData: Data, to pointSize: CGSize, scale: CGFloat) -> UIImage {
        let imageSourceOptions = [kCGImageSourceShouldCache: false] as CFDictionary
        let imageSource = CGImageSourceCreateWithData(imageData as CFData, imageSourceOptions)!

        let maxDimensionInPixels = max(pointSize.width, pointSize.height) * scale
        let downsampleOptions = [
            kCGImageSourceCreateThumbnailFromImageAlways: true,
            kCGImageSourceCreateThumbnailWithTransform: true,
            kCGImageSourceThumbnailMaxPixelSize: maxDimensionInPixels,
            kCGImageSourceShouldCacheImmediately: false
            ] as CFDictionary

        let downsampledImage = CGImageSourceCreateThumbnailAtIndex(imageSource, 0, downsampleOptions)!
        /// Core Foundation objects returned from annotated APIs are automatically memory managed in Swift
        /// you do not need to invoke the CFRetain, CFRelease, or CFAutorelease functions yourself.
        return UIImage(cgImage: downsampledImage)
    }
}
其中,有一些选项设置downsampleOptions:
- kCGImageSourceCreateThumbnailFromImageAlways
- kCGImageSourceThumbnailMaxPixelSize
- kCGImageSourceShouldCache 可以设置为NO,避免缓存解码后的数据。默认为YES。
- kCGImageSourceShouldCacheImmediately 可以设置为YES,避免在需要渲染的时候才做图片解码。默认是NO,不会立即进行解码渲染,而是在屏幕上显示时才去渲染。
kCGImageSourceShouldCache: specifies whether image decoding and caching should happen at image creation time. The value of this key must be a CFBooleanRef. The default value is kCFBooleanFalse (image decoding will happen at rendering time).
即默认不会解码UIImage,而是在渲染时候才去解码,在主线程执行。
而该downsampling过程非常占用CPU资源,一定要放到异步线程去执行,会阻塞主线程。
dispatch_async(dispatch_get_global_queue(DISPATCH_QUEUE_PRIORITY_DEFAULT, 0), ^{
    UIImage *image = [self downsamplingImageAt:url withSize:size scale:1];
    dispatch_async(dispatch_get_main_queue(), ^{
        self.imageView.image = image
    });
});
如果采用第二个接口,先将UIImage转换成NSData,在执行ImageIO对应的缩放操作,需要的仅是NSData的内存,而不会有实际图片的解码带来的内存消耗。
缓存优化
对于缓存数据或可重建数据,尽量使用NSCache或NSPurableData,收到内存警告时,系统自动处理内存释放操作。并且是线程安全的。
下边代码是SDWebImage的cache:
// A memory cache which auto purge the cache on memory warning and support weak cache.
@interface SDMemoryCache <KeyType, ObjectType> : NSCache <KeyType, ObjectType>

@end

// Private
@interface SDMemoryCache <KeyType, ObjectType> ()

@property (nonatomic, strong, nonnull) SDImageCacheConfig *config;
@property (nonatomic, strong, nonnull) NSMapTable<KeyType, ObjectType> *weakCache; // strong-weak cache
@property (nonatomic, strong, nonnull) dispatch_semaphore_t weakCacheLock; // a lock to keep the access to `weakCache` thread-safe

- (instancetype)init NS_UNAVAILABLE;
- (instancetype)initWithConfig:(nonnull SDImageCacheConfig *)config;

@end

@implementation SDMemoryCache

// Current this seems no use on macOS (macOS use virtual memory and do not clear cache when memory warning). So we only override on iOS/tvOS platform.
// But in the future there may be more options and features for this subclass.
#if SD_UIKIT

- (void)dealloc {
    [[NSNotificationCenter defaultCenter] removeObserver:self name:UIApplicationDidReceiveMemoryWarningNotification object:nil];
}

- (instancetype)initWithConfig:(SDImageCacheConfig *)config {
    self = [super init];
    if (self) {
        // Use a strong-weak maptable storing the secondary cache. Follow the doc that NSCache does not copy keys
        // This is useful when the memory warning, the cache was purged. However, the image instance can be retained by other instance such as imageViews and alive.
        // At this case, we can sync weak cache back and do not need to load from disk cache
        self.weakCache = [[NSMapTable alloc] initWithKeyOptions:NSPointerFunctionsStrongMemory valueOptions:NSPointerFunctionsWeakMemory capacity:0];
        self.weakCacheLock = dispatch_semaphore_create(1);
        self.config = config;
        [[NSNotificationCenter defaultCenter] addObserver:self
                                                 selector:@selector(didReceiveMemoryWarning:)
                                                     name:UIApplicationDidReceiveMemoryWarningNotification
                                                   object:nil];
    }
    return self;
}

- (void)didReceiveMemoryWarning:(NSNotification *)notification {
    // Only remove cache, but keep weak cache
    [super removeAllObjects];
}

// `setObject:forKey:` just call this with 0 cost. Override this is enough
- (void)setObject:(id)obj forKey:(id)key cost:(NSUInteger)g {
    [super setObject:obj forKey:key cost:g];
    if (!self.config.shouldUseWeakMemoryCache) {
        return;
    }
    if (key && obj) {
        // Store weak cache
        LOCK(self.weakCacheLock);
        [self.weakCache setObject:obj forKey:key];
        UNLOCK(self.weakCacheLock);
    }
}

- (id)objectForKey:(id)key {
    id obj = [super objectForKey:key];
    if (!self.config.shouldUseWeakMemoryCache) {
        return obj;
    }
    /// 内存缓存中若没有,则从weakCache中找,找到了,再缓存到内存中?
    if (key && !obj) {
        // Check weak cache
        LOCK(self.weakCacheLock);
        obj = [self.weakCache objectForKey:key];
        UNLOCK(self.weakCacheLock);
        if (obj) {
            // Sync cache
            NSUInteger cost = 0;
            if ([obj isKindOfClass:[UIImage class]]) {
                cost = SDCacheCostForImage(obj);
            }
            [super setObject:obj forKey:key cost:cost];
        }
    }
    return obj;
}

- (void)removeObjectForKey:(id)key {
    [super removeObjectForKey:key];
    if (!self.config.shouldUseWeakMemoryCache) {
        return;
    }
    if (key) {
        // Remove weak cache
        LOCK(self.weakCacheLock);
        [self.weakCache removeObjectForKey:key];
        UNLOCK(self.weakCacheLock);
    }
}

- (void)removeAllObjects {
    [super removeAllObjects];
    if (!self.config.shouldUseWeakMemoryCache) {
        return;
    }
    // Manually remove should also remove weak cache
    LOCK(self.weakCacheLock);
    [self.weakCache removeAllObjects];
    UNLOCK(self.weakCacheLock);
}
SDMemoryCache继承自NSCache,且使用NSMapTable来存储strong-weak cache(key是strong,value是weak的)。
/**
 * The option to control weak memory cache for images. When enable, `SDImageCache`'s memory cache will use a weak maptable to store the image at the same time when it stored to memory, and get removed at the same time.
 * However when memory warning is triggered, since the weak maptable does not hold a strong reference to image instacnce, even when the memory cache itself is purged, some images which are held strongly by UIImageViews or other live instances can be recovered again, to avoid later re-query from disk cache or network. This may be helpful for the case, for example, when app enter background and memory is purged, cause cell flashing after re-enter foreground.
 * Defautls to YES. You can change this option dynamically.
 */
@property (assign, nonatomic) BOOL shouldUseWeakMemoryCache;
shouldUseWeakMemoryCache为YES,则将图片数据缓存到内存的同时,使用一个weak maptable存储该image,如image key(strong)->image(weak)。
若内存警告,则缓存的image被清除,一些image可以恢复,则该weak maptable就不受影响。否则,image被清除,则SD就要重新处理该内存缓存,如从disk查询或网络请求。
如App进入后台,释放掉内存,再进入前台时,view的cell中的image可以重建,然后放到weak maptable中,而不需要再从disk读取。
加载超大图片的正确姿势
对于一些微信长图/微博长图之类的,或者一些需要展示全图,然后拖动来查看细节的场景,可以使用CATiledLayer来进行分片加载,避免直接对图片的所有部分进行解码和渲染,以节省资源。在滑动时,指定目标位置,映射原图指定位置的部分图片进行解码和渲染。
进入后台
释放占用较大的内存,再次进入前台时按需加载。防止App在后台时被系统杀掉。
一般监听UIApplicationDidEnterBackground的系统通知即可。
ViewController相关的优化
对于UITabBarController这样有多个子VC的情况,切换tab时候,如果不显示的ViewController依然占用较大内存,可以考虑释放,需要时候再加载。
超大UIView相关的优化
如果UIView的size过大,如果全部绘制,则会消耗大量内存,以及阻塞主线程。
常见的场景如微信消息的超长文本,则可将其分割成多个UIView,然后放到UITableView中,利用cell的复用机制,减少不必要的渲染和内存占用。
EXC_RESOURCE_EXCEPTION异常
iOS中没有交换空间,而是采用了JetSam机制。
当App使用的内存超出限制时,系统会抛出EXC_RESOURCE_EXCEPTION异常。
内存泄漏
内存泄漏,有些是能通过工具检测出来的。而还有一些无法检测,需要自行分析。
循环引用
通常对象间相互持有或者构成环状持有关系,则会引起循环引用。
常见的有对象间引用、委托模式下的delegate,以及Block引起的:
@property (nonatomic) id<SomeRetainedDelegate> delegate;

self.delegate = self;
[[NSNotificationCenter defaultCenter]
        addObserverForName:UIApplicationDidReceiveMemoryWarningNotification
                    object:nil
                     queue:nil
                usingBlock:^(NSNotification *_Nonnull note) {
                    // Warning, memory leak
                    self.testProp = @"test";
                }];
UIAlertAction *ok = [UIAlertAction actionWithTitle:@"确定"
                                             style:UIAlertActionStyleDefault
                                           handler:^(UIAlertAction *_Nonnull action) {
                                                // Warning, memory leak
                                                self.testProp = @"test";
                    }];
NSTimer
关于NSTimer,可以参考更详细的这篇博客:
其他场景
一些滥用的单例,尤其是包含了不少block的单例,很容易产生内存泄漏。排查时候需要格外细心。
离屏渲染
我们经常会需要预先渲染文字/图片以提高性能,此时需要尽可能保证这块 context 的大小与屏幕上的实际尺寸一致,避免浪费内存。可以通过 View Hierarchy 调试工具,打印一个 layer 的 contents 属性来查看其中的 CGImage(backing image)以及其大小。layer的contents属性即可看到其CGImage(backing store)的大小。
Offscreen rendering is invoked whenever the combination of layer properties that have been specified mean that the layer cannot be drawn directly to the screen without pre- compositing. Offscreen rendering does not necessarily imply software drawing, but it means that the layer must first be rendered (either by the CPU or GPU) into an offscreen context before being displayed.
离屏渲染未必会导致性能降低,而是会额外加重GPU的负担,可能导致一个V-sync信号周期内,GPU的任务未能完成,最终结果就是可能导致卡顿。
iOS系统对于Release环境下的优化
实际的release环境下,Apple会对一些场景自动优化,如release环境下,申请50MB的Dirty Memory,但实际footprint和resident不会增加50MB,具体Apple怎么做的不清楚。
启动优化
App启动时,加载相应的二进制文件或者dylib到内存中。当进程访问一个虚拟内存page,但该page未与物理内存形成映射关系,则会触发缺页中断,然后再分配物理内存。过多的缺页中断会导致一定的耗时。
二进制重排的启动优化方案,是通过减少App启动时候的缺页中断次数,来加速App启动。
字节对齐
当定义object的时候,尽量使得内存页对齐也会有帮助。小内存属性放一起,大内存属性放一起。
参考资料
- Memory Usage Performance Guidelines
- WWDC 2018:iOS 内存深入研究
- WWDC 2018:iOS 内存深入剖析
- iOS 内存管理研究
- Instruments学习之Allocations
- iOS内存abort(Jetsam) 原理探究
- iOS图像最佳实践总结
- 探讨iOS 中图片的解压缩到渲染过程
- iOS微信内存监控
- Understanding Memory on iOS
- Finding iOS memory
- Tracking IOKit Dirty Memory in iOS using Instruments
- glDeleteTextures函数对内存的优化
- MemoryFootprintCocoa.cpp
- kern_memorystatus.c
- iOS-Monitor-Platform
- iOS-Monitor-Platform
- 抖音研发实践:基于二进制文件重排的解决方案 APP启动速度提升超15%
