功能需求
趋势图根据所有显示指标的最大值(最小值和区间先暂不考虑)自动判断在那个Y坐标展示(左Y轴,右Y轴)
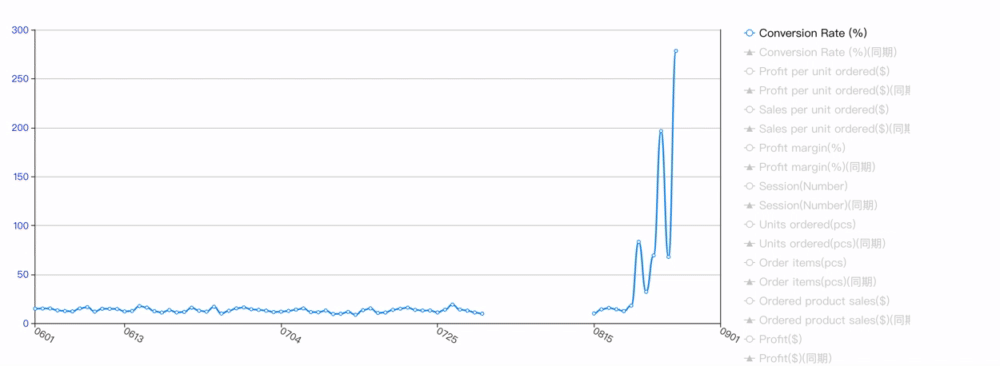
(1)当只有一个指标时,始终用【左Y轴】显示;
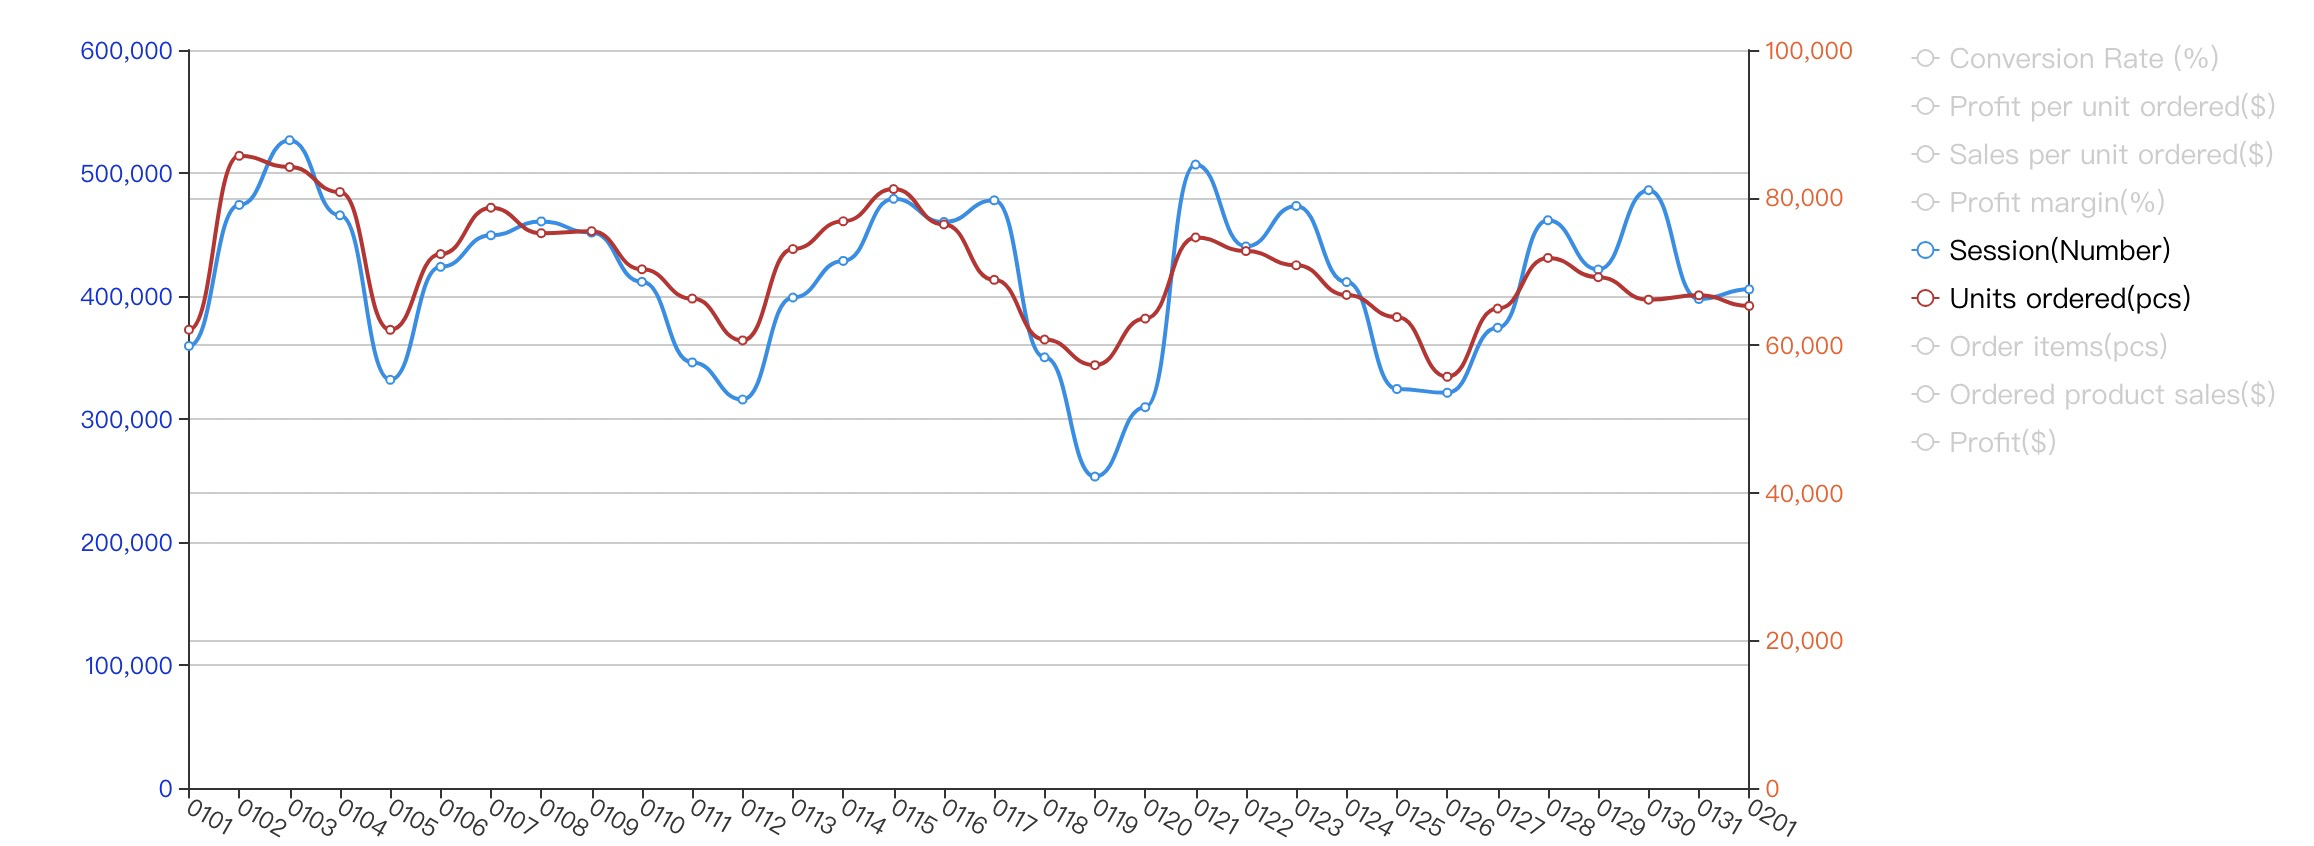
(2)当大于等于2个选择指标时,以其中所有指标数据最大值(每个指标最大值中的最大值)为参考,凡指标的最大值小于其5倍的,都显示在【右Y轴】,其它的都显示【左Y轴】。
(3)【右Y轴】的刻度和【左Y轴】的一样,最大刻度根据最大数据自动适应;但允许系统强制配置最大和最小值。
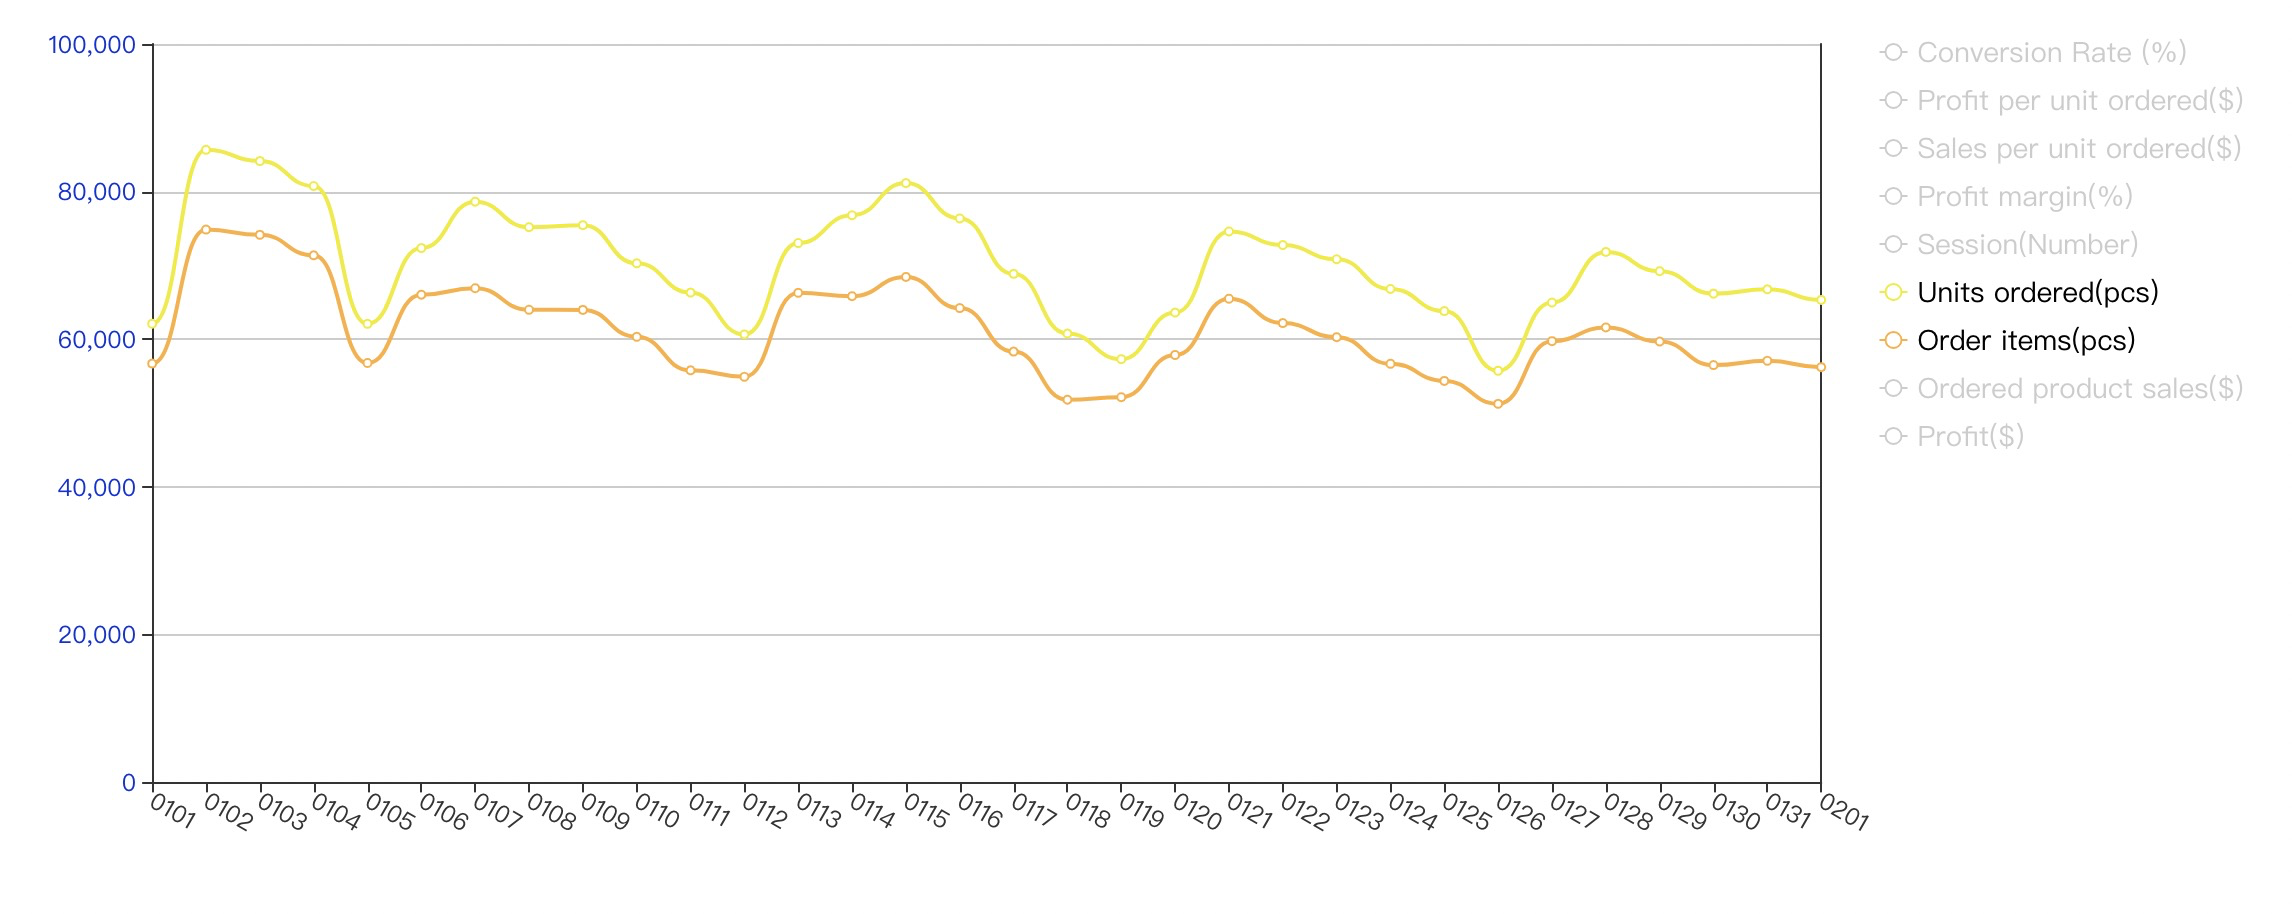
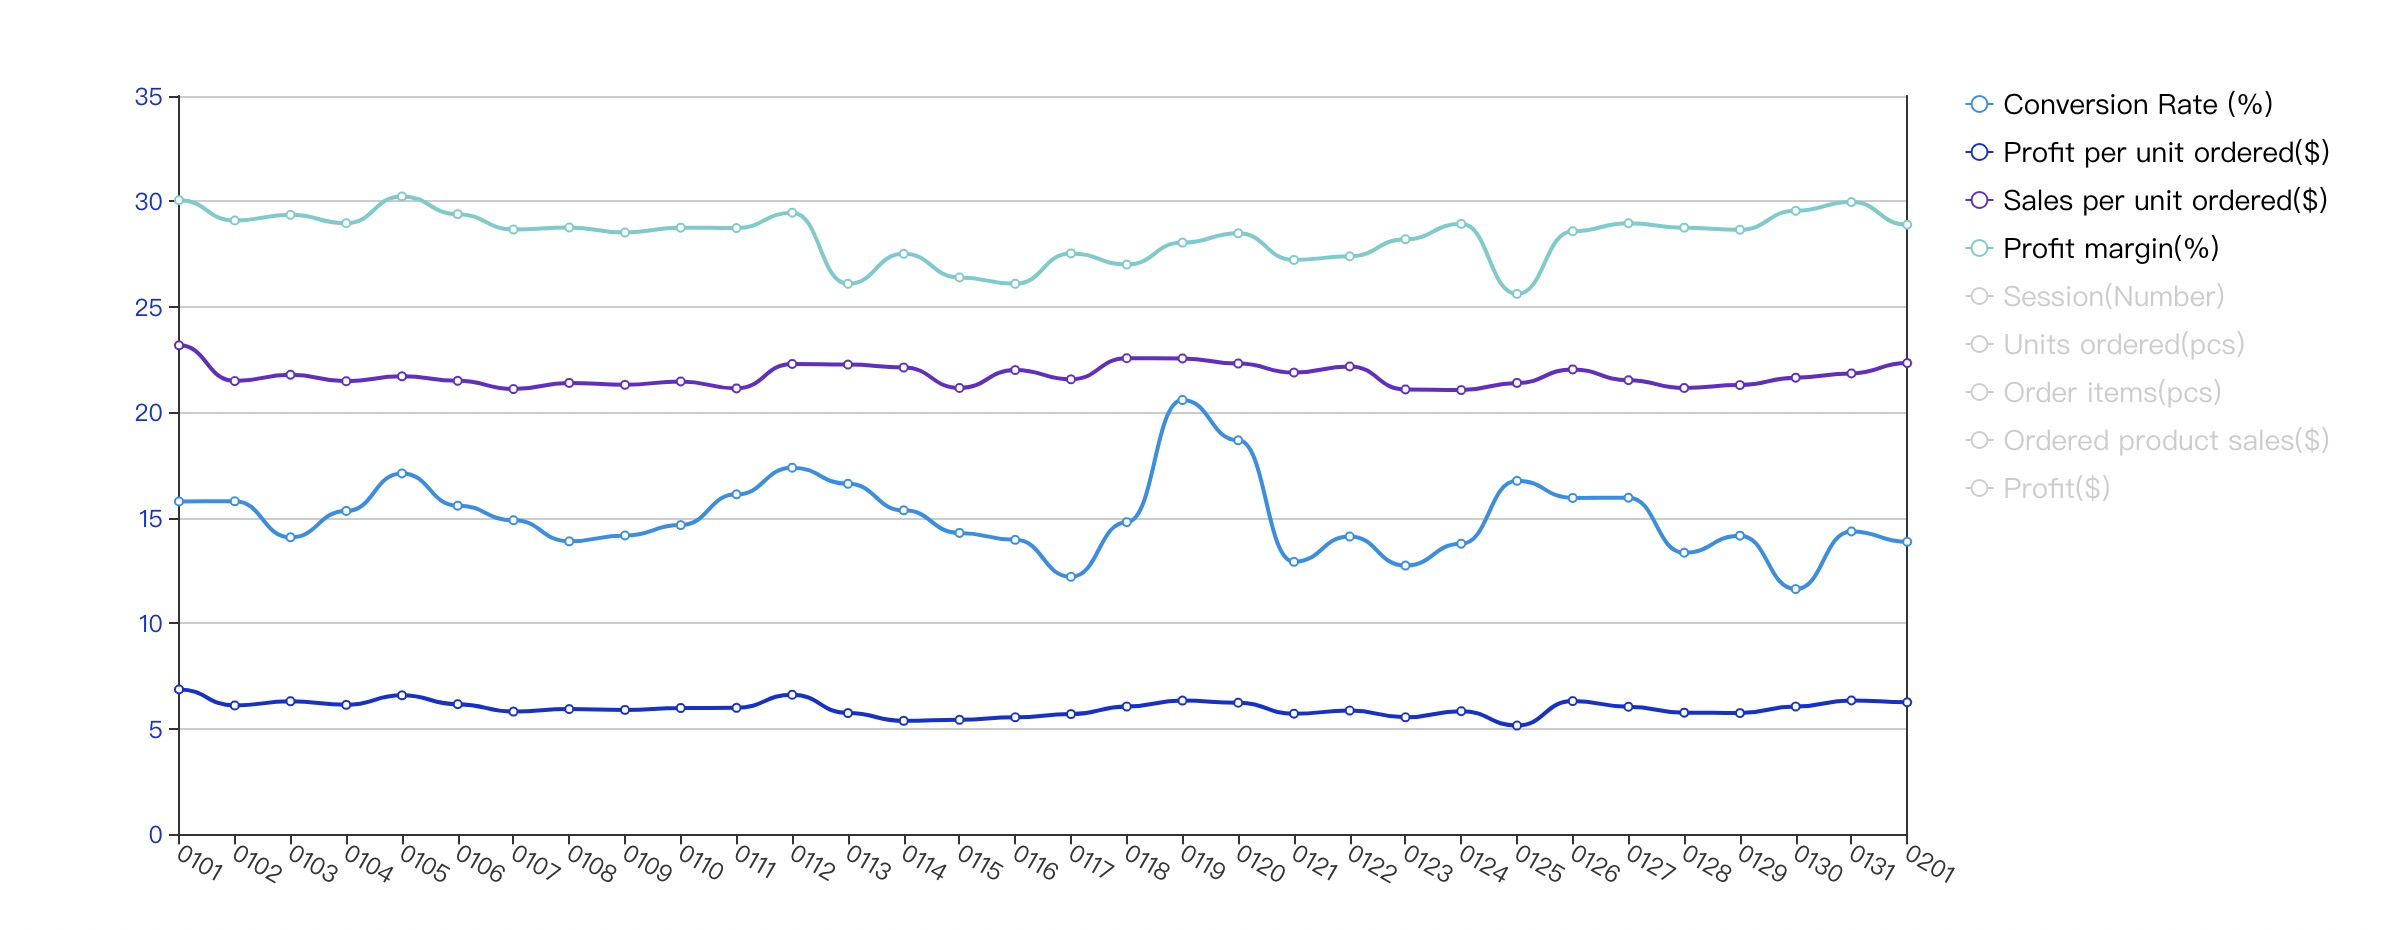
(4)如果选择多个指标时,同一个坐标轴的指标使用相同的色系(需要UI预设两组色系的颜色定义),若只有一条轴不区分两组色系
(5)同期时与原指标中的最大值判断,统一放在一个坐标轴,并且颜色一样。
功能实现
1.监听legendselectchanged事件,在操作legend数据时触发
this.myChart.on('legendselectchanged', params => {
                this.initYAxis(params.selected);
            });
2.初始化Y轴函数
initYAxis(params) {
            let legendSelect = [];
            let legendSelectMax = {};

            // 遍历出选中的数据
            for (let i in params) {
                if (params[i]) {
                    legendSelect.push(i);
                }
            }
            legendSelect.map(one => legendSelectMax[one] = this.legendSeriesMax[one]);
            let legendSeries = legendSelect.map(one => this.legendSeriesMax[one]);
            let leftYAxis = Math.max.apply(null, legendSeries);

            let rightLines = [];
            let leftLines = [];

            // 选中数据大于一条时,区分选择左右两条Y轴
            if ( Object.keys(legendSelectMax).length > 1) {
                for (let i in legendSelectMax) {
                    if (legendSelectMax[i] && (leftYAxis / legendSelectMax[i] > 5 || leftYAxis / legendSelectMax[i] < -5)) {
                        rightLines.push(i);
                    } else {
                        leftLines.push(i);
                    }
                }
            } else {
                leftLines = legendSelect;
            }
            // 设置每条数据的yAxisIndex值和颜色,优先级高于初始颜色
            this.myChartConfig.optionModel.series.map((one, index) => {
                if (rightLines.length > 0) {
                    if (rightLines.indexOf(one['name']) > -1) {
                        let i = rightLines.indexOf(one['name']);
                        one['yAxisIndex'] = 1;
                        one['itemStyle'] = {color: this.myChartConfig.colorStyle.rightColor[i%this.myChartConfig.colorStyle.rightColor.length]};
                    } else if (leftLines.indexOf(one['name']) > -1) {
                        let i = leftLines.indexOf(one['name']);
                        one['yAxisIndex'] = 0;
                        one['itemStyle'] = {color: this.myChartConfig.colorStyle.leftColor[i%this.myChartConfig.colorStyle.leftColor.length]};
                    }
                } else {
                    one['yAxisIndex'] = 0;
                    one['itemStyle'] = {color: null};
                }
            });
            // 同期时与原指标中的最大值判断,统一放在一个坐标轴。数据线颜色也相同
            legendSelect.map(one => {
                if (one.indexOf('同期') > -1 && legendSelectMax.hasOwnProperty(one.replace('(同期)', ''))) {
                    let lastSeries = this.myChartConfig.optionModel.series.filter(o => o['name'] === one);
                    let nowSeries = this.myChartConfig.optionModel.series.filter(o => o['name'] === one.replace('(同期)', ''));
                    if (this.legendSeriesMax[one] > this.legendSeriesMax[one.replace('(同期)', '')]) {
                        nowSeries[0]['yAxisIndex'] = lastSeries[0]['yAxisIndex'];
                        nowSeries[0]['itemStyle'] = lastSeries[0]['itemStyle'];
                    } else {
                        lastSeries[0]['yAxisIndex'] = nowSeries[0]['yAxisIndex'];
                        lastSeries[0]['itemStyle'] = nowSeries[0]['itemStyle'];
                    }
                };
            });
            let newOptionModel = {
                series: this.myChartConfig.optionModel.series
            };
            this.myChart.setOption(newOptionModel);
        },
效果实现
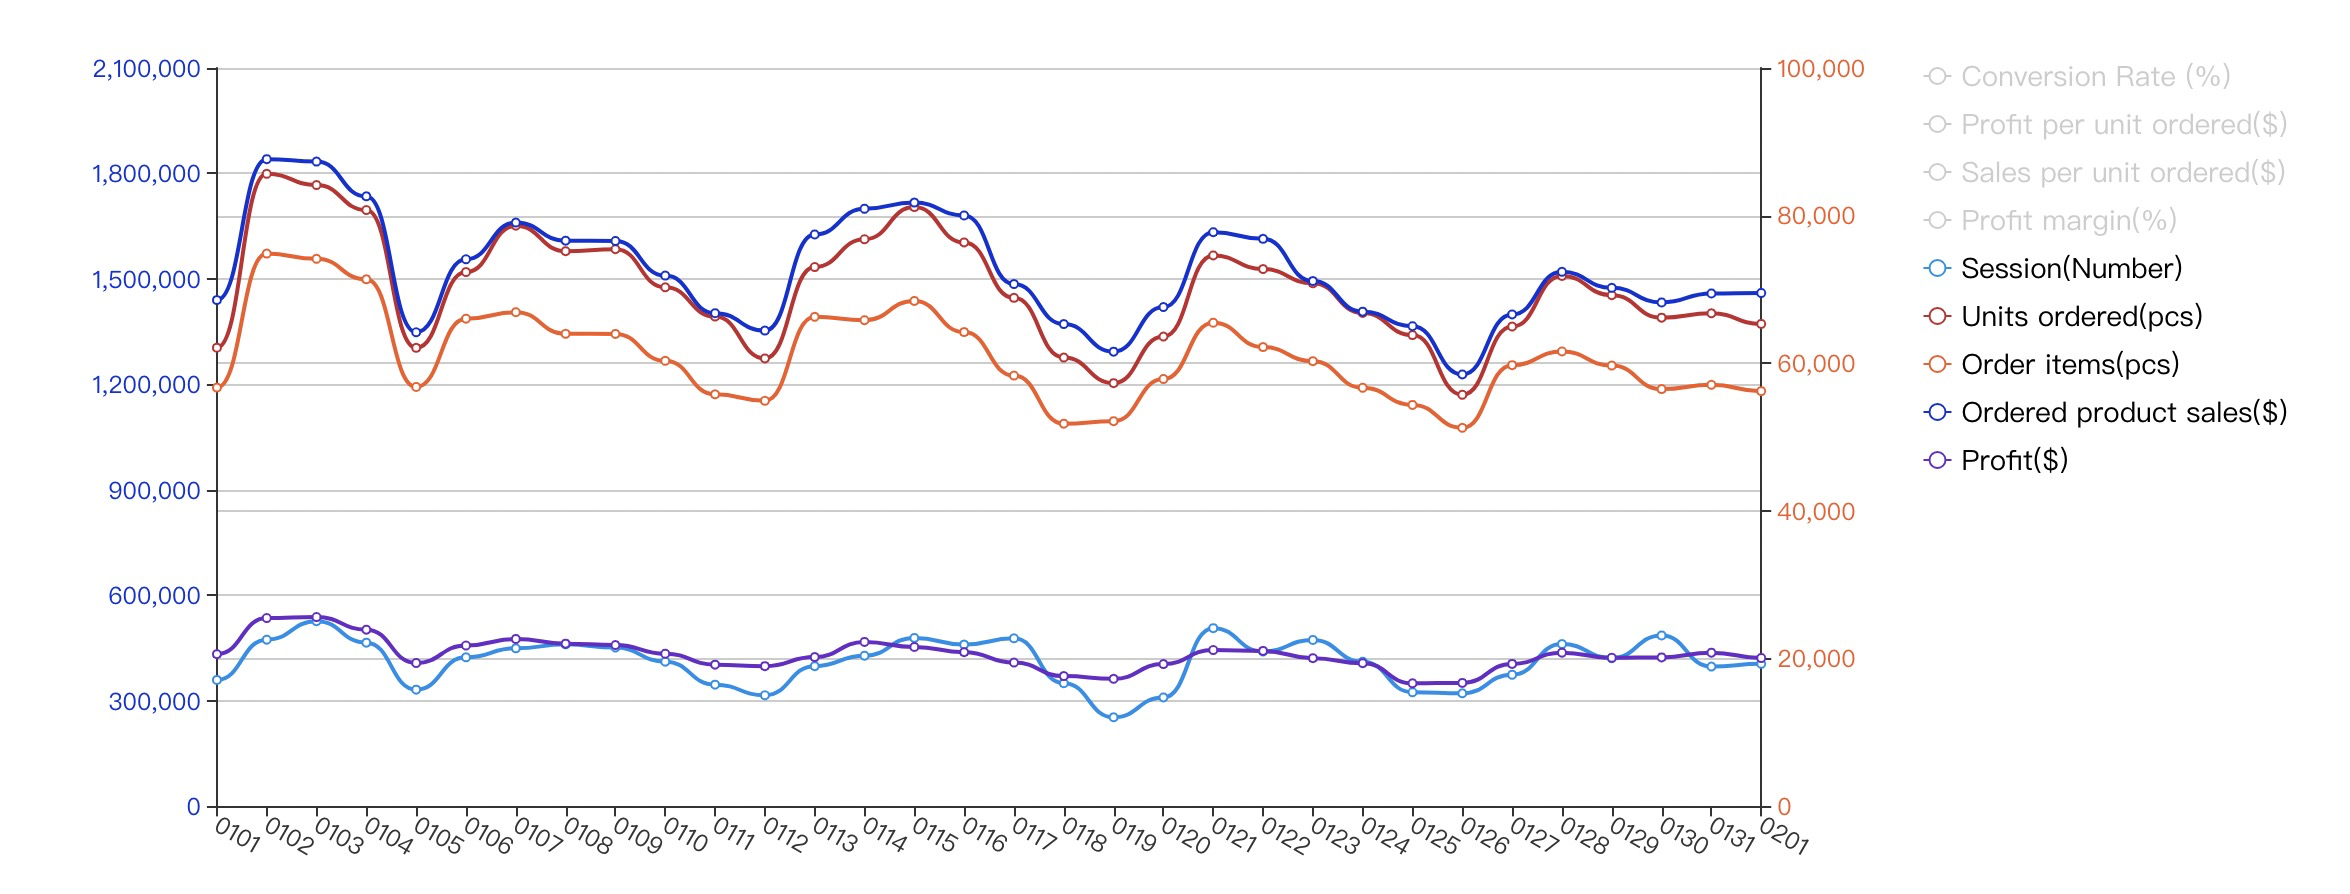
数据未差5倍显示在同一Y轴