

一、内存泄露分析工具简介
Profiler
-
预判哪个类产生内存泄露
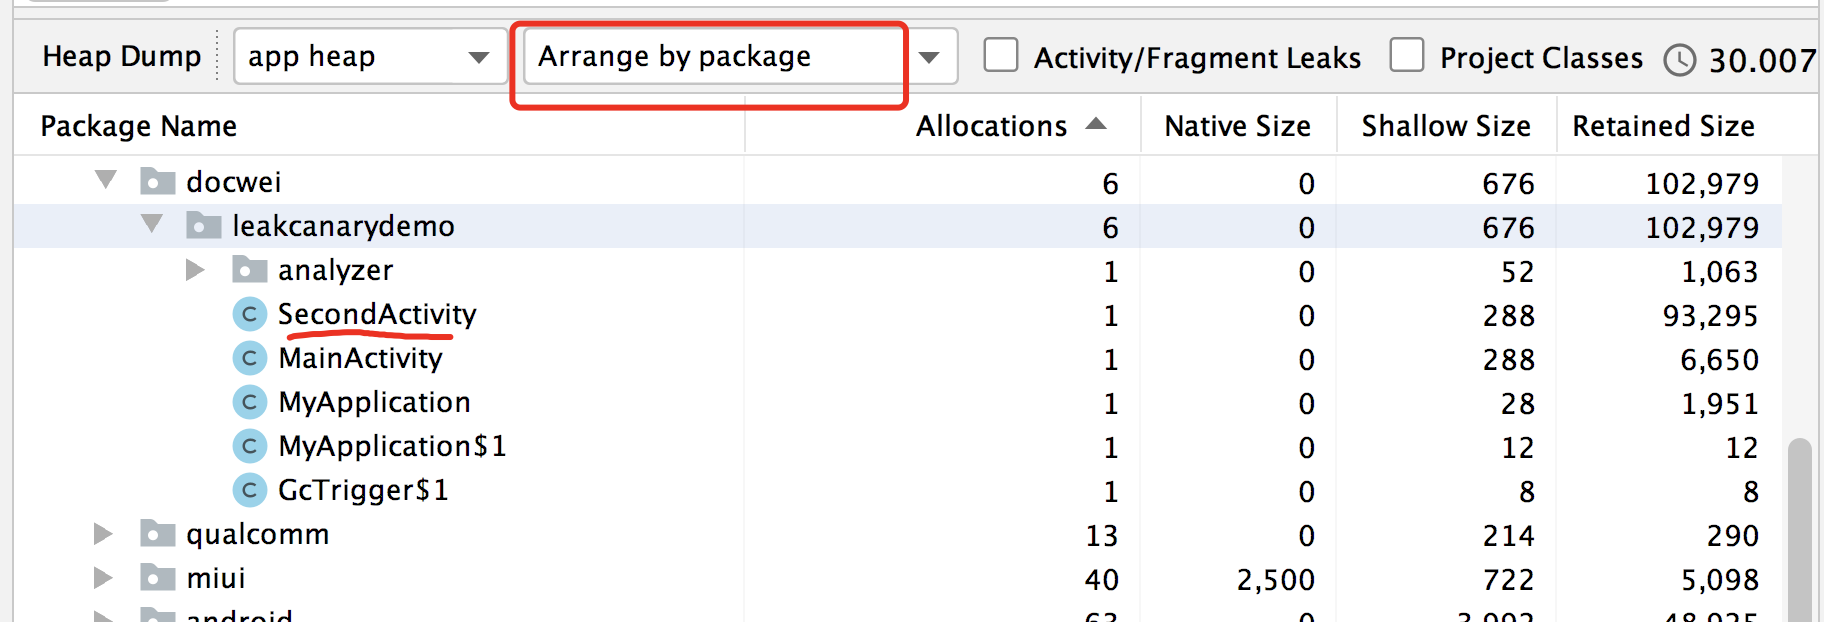
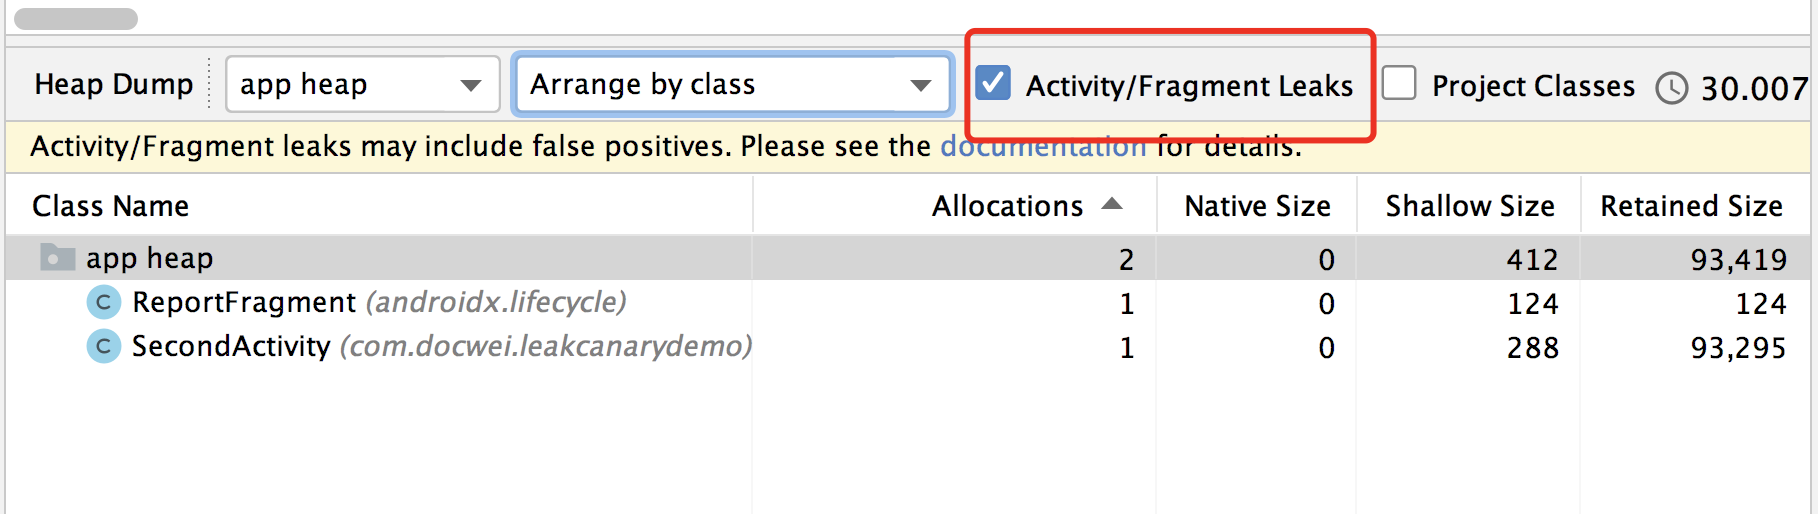
android studio 3.6 新增了一个Activity/Fragment Leaks选项,可以快速定位到是哪个类存在内存泄露了,之前的版本没有这个选项,也可通过选择Arrange by package来查看占用内存的类,预判内存泄露的类(比如B activity页面关闭了,但是还能看到它占用内存,那就可能是它了)。 -
获取hprof文件
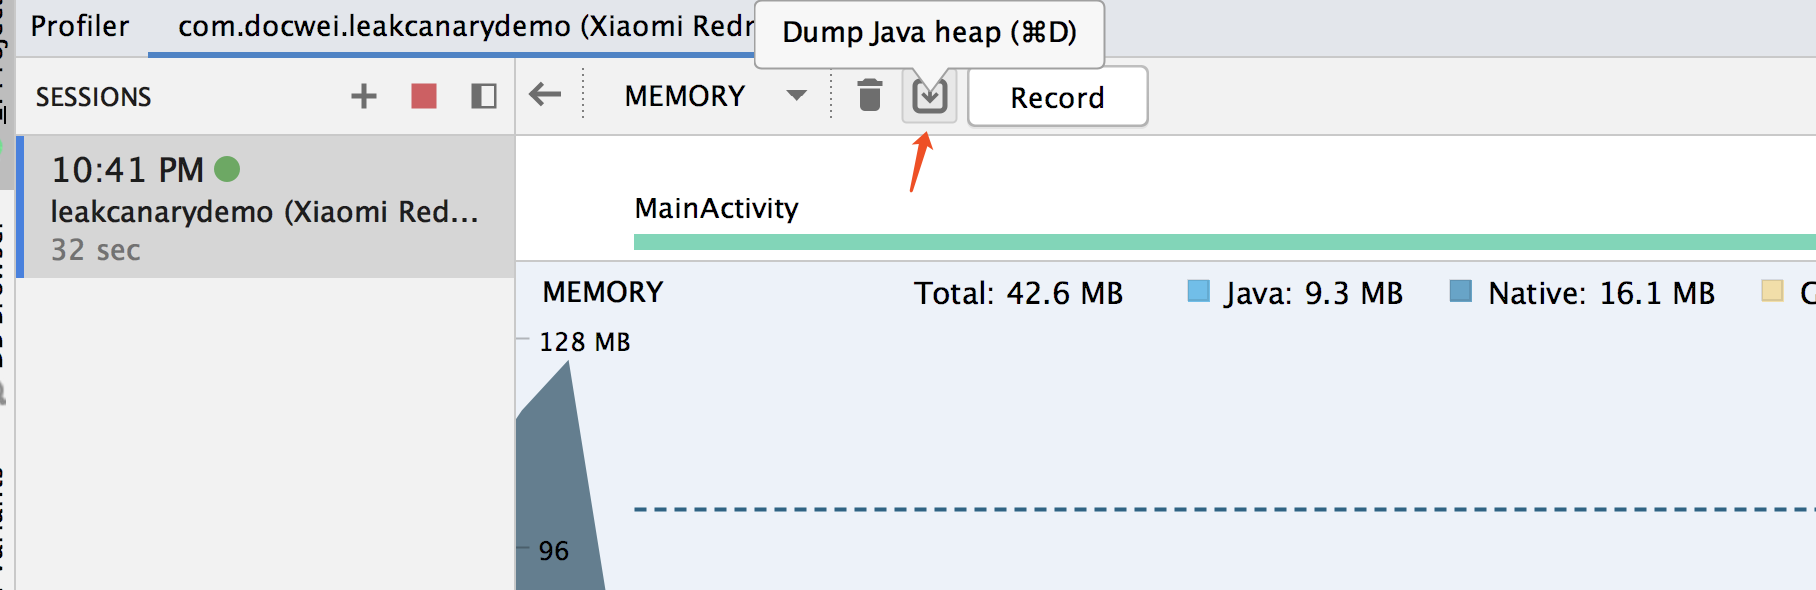
手动触发 Dump java heap,获取到hprof文件。
MAT
-
查找泄露链
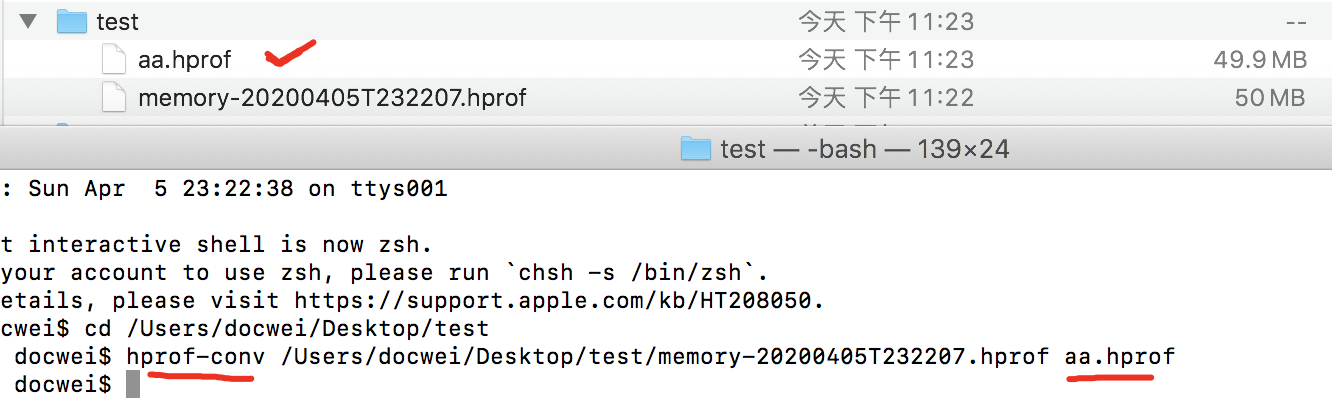
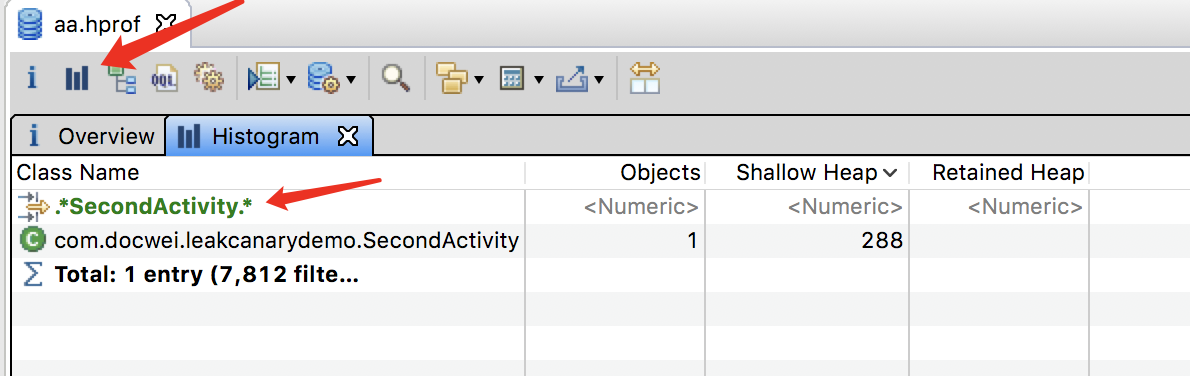
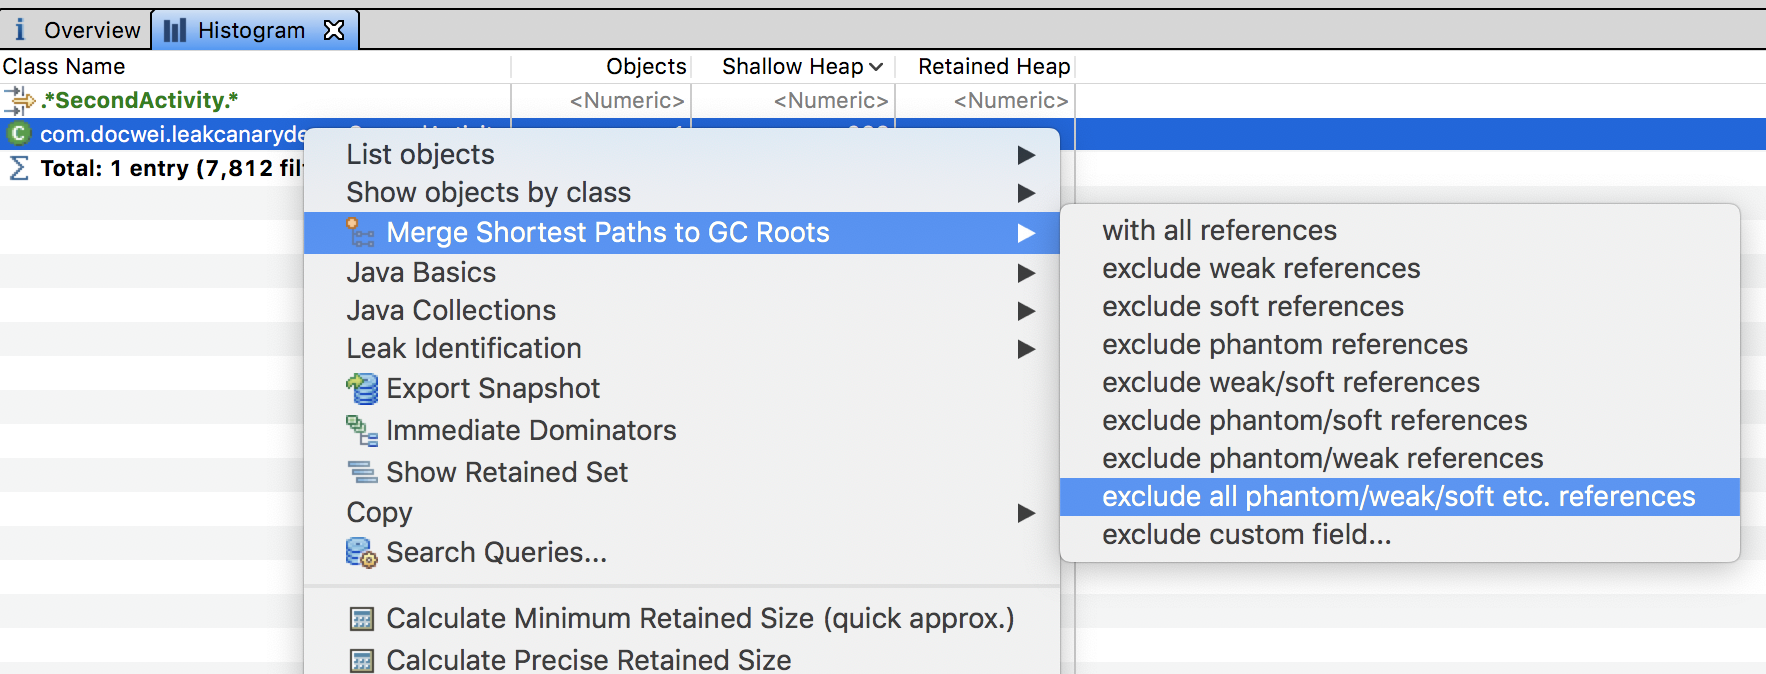
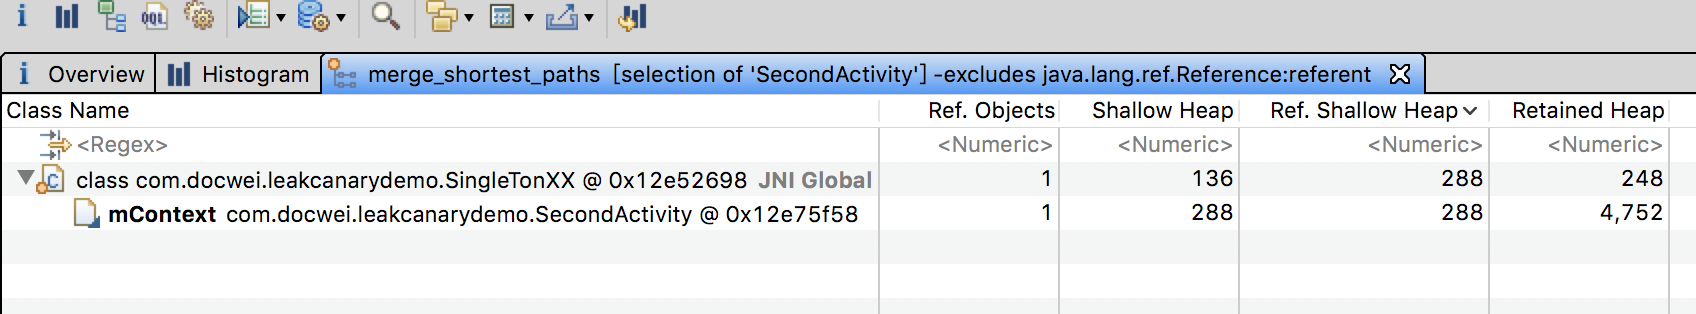
android studio导出的hprof文件,需要经过个hprof-conv 命令转一下,才能被MAT识别,导入到MAT,查找泄露类的GcRoots链,排除软引用、弱引用、虚引用,剩下的就是我们需要的泄露链了。
LeakCanary
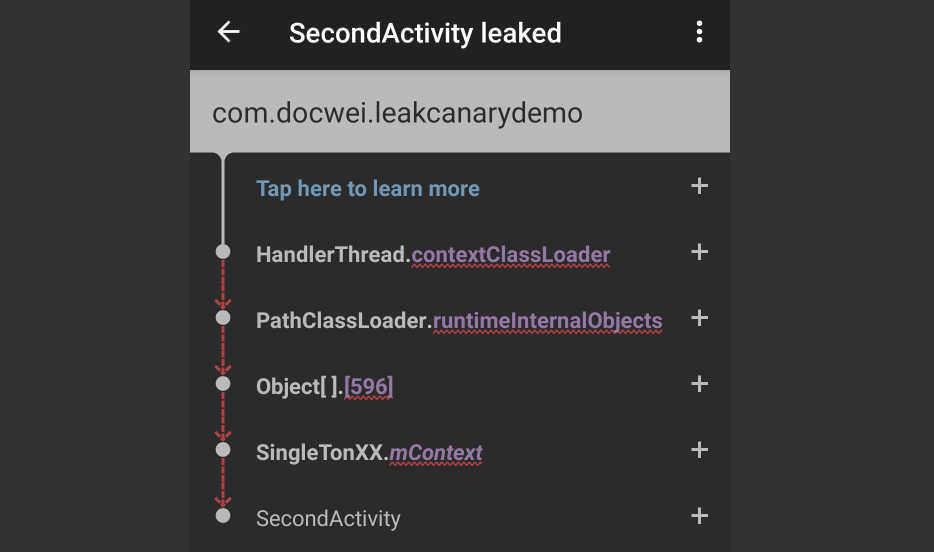
LeakCanary的图标很nice,一只金丝雀在黄框里面,很形象啊。 其接入简单,查看泄露链也简单,但是有可能你忍受不了它在dump时的短暂暂停,频繁的暂停让测试人员以为是大bug。其实也可能是bug了,它检测到了可能的内存泄露。
二、内存泄露分析工具使用
Profiler配合MAT完成内存泄露检测。
先造一个内存泄露出来
public class SingleTonXX {
    // 只是为了制造内存泄露用,请勿这么写
    public static Context mContext;
    private SingleTonXX() {
    }
    private static volatile SingleTonXX sSingleTonXX;
    public static SingleTonXX getInstance(Context context) {
        if (sSingleTonXX == null) {
            synchronized (SingleTonXX.class) {
                if (sSingleTonXX == null) {
                    mContext=context;
                    return new SingleTonXX();
                }
            }
        }
        return sSingleTonXX;
    }
}
public class SecondActivity extends AppCompatActivity {
    @Override
    protected void onCreate(Bundle savedInstanceState) {
        super.onCreate(savedInstanceState);
        setContentView(R.layout.activity_second);
        SingleTonXX.getInstance(this);
    }
}
先用Profile dump一下
几个关键的值:
Shallow Size: 对象本身占用内存的大小,不包含其引用的对象。
Retained Size: 对象本身的Shallow Size + 对象能直接或间接引用的对象的Shallow Size,也就是说 Retained Size 就是该对象被 Gc 之后所能回收内存的总和。
Heap Size: 堆size。
Allocated: 堆中已分配的大小,即 App应用实际占用的内存大小。
导出hprof文件,然后转换一下,这里转成aa.hprof了。
-vm
/Library/Java/JavaVirtualMachines/jdk1.8.0_191.jdk/Contents/Home/bin/java
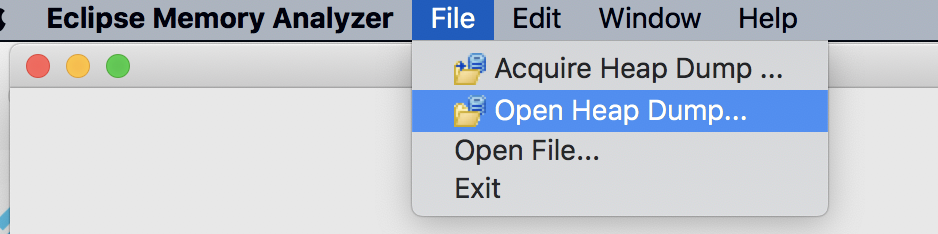
打开刚刚的aa.hprof文件
Q: Gc Roots链是什么,为什么找这个链?
GC 时怎么判定某个对象是垃圾对象,用到了根搜索算法。
把GC Roots的对象作为起始点,寻找对应的引用节点,找到这些引用节点后,从这些节点开始向下继续寻找它们的引用节点,形成一条引用链。
可达对象: 一个对象与GC Roots的对象有引用链连接。
不可达对象: 一个对象与GC Roots的对象没有引用链连接,就是我们要回收的对象。
GC Roots的对象: GC管理的主要区域是Java堆,一般情况下只针对堆进行垃圾回收。被GC Roots引用的对象不被GC回收,可以作为GCRoots对象的是 java虚拟机栈中引用的对象、 本地方法栈中jni引用的对象、 方法区运行时常量池引用的对象、 方法区中静态属性引用的对象、 运行中的线程(可联想到--内存泄露啊)、 由引导类加载器加载的对象、 GC控制的对象。
使用LeakCanary内存检测
三、LeakCanary的原理(version 1.6.3)
LeakCanary先判断是否存在内存泄露,存在内存泄露,则dump当前内存快照,然后解析dump文件,最后显示出来。
判断是否存在内存泄露的逻辑确实很简单,核心部分使用的是java的Api,dump操作使用的android系统提供的方法,解析dump文件借助的haha库,难点在dump文件的解析。但是我不提解析,自己看吧,有点复杂。
-
判断是否存在内存泄露
先看下 java 的 api
//obj 强引用对象
Object obj=new Object();
ReferenceQueue queue = new ReferenceQueue();
//使用弱引用封装 并指定queue
WeakReference<Object> objectWeakReference = new WeakReference<>(obj,queue);
//断开Gc Roots链
obj = null;
Runtime.getRuntime().gc();
System.runFinalization();
Log.e("test", "onCreate: queue----"+queue.poll());
当 obj 被回收的时候,其弱引用对象会被放入到这个指定的 queue( obj 的内存状态从pending变成enqueue)。正常情况下,queue.poll( )的值是objectWeakReference;如果为null,则可能存在内存泄露。
Leakcanary如何判断的呢?
针对activity:
application.registerActivityLifecycleCallbacks(new ActivityLifecycleCallbacksAdapter() {
  @Override public void onActivityDestroyed(Activity activity) {
    refWatcher.watch(activity);
  }
} );
针对Fragment:
拿到对应的activity的FragmentManager
supportFragmentManager.registerFragmentLifecycleCallbacks( new FragmentManager.FragmentLifecycleCallbacks() {
    @Override public void onFragmentViewDestroyed(FragmentManager fm, Fragment fragment) {
        View view = fragment.getView();
        if (view != null) {
            refWatcher.watch(view);
        }
    }
    @Override public void onFragmentDestroyed(FragmentManager fm, Fragment fragment) {
        refWatcher.watch(fragment);
    }
}, true);
public class RefWatcher {
    private static final String HPROF_SUFFIX = ".hprof";
    private static final String PENDING_HEAPDUMP_SUFFIX = "_pending" + HPROF_SUFFIX;
   public static volatile RefWatcher sInstance;
    public static  RefWatcher  getInstance(){
        if(sInstance==null){
            synchronized (RefWatcher.class){
                if(sInstance==null){
                    return new RefWatcher(new CopyOnWriteArraySet<String>(),new ReferenceQueue<>());
                }
            }
        }
        return sInstance;
    }
    private final Handler mBackgroundHander;
    private final Handler mMainHandler;

    private  RefWatcher(Set<String> retainedKeys, ReferenceQueue<Object> queue) {
        this.retainedKeys = retainedKeys;
        this.queue = queue;
        HandlerThread handlerThread=new HandlerThread("watch_leak");
        handlerThread.start();
        mBackgroundHander = new Handler(handlerThread.getLooper());
        mMainHandler = new Handler(Looper.getMainLooper());

    }
    private final Set<String> retainedKeys;
    private final ReferenceQueue<Object> queue;
    public void watch(Object object) {
        if(object==null) {
            return;
        }
        String key = UUID.randomUUID().toString();
        retainedKeys.add(key);
        //将key与object绑定,所以新建了这个KeyedWeakReference;
        KeyedWeakReference weakReference=new KeyedWeakReference(object,key,queue);
        ensureGoneAsync(weakReference);
    }
    private void ensureGoneAsync(final KeyedWeakReference weakReference) {
        //leakCanary大概等了5秒时间,再去检测是否泄露的
        mBackgroundHander.postDelayed(new Runnable() {
            @Override
            public void run() {
                mMainHandler.post(new Runnable() {
                    @Override
                    public void run() {
                        Looper.myQueue().addIdleHandler(new MessageQueue.IdleHandler() {
                            @Override public boolean queueIdle() {
                                ensureGone(weakReference);
                                return false;
                            }
                        });
                    }
                });
            }
        },5000);
    }
    public void ensureGone(KeyedWeakReference weakReference){
        removeWeaklyReachableReferences();
        //说明对象被正常回收了
        if(!retainedKeys.contains(weakReference.key)){
            return;
        }
        //Gc一次之后
        GcTrigger.DEFAULT.runGc();
        //再清理操作
        removeWeaklyReachableReferences();

        if(retainedKeys.contains(weakReference.key)){
            Log.e("leak1", "catch a leak point "+weakReference );
            //进行内存快照 key还在说明 reference不在这个ReferenceQueue里面,可能就发生内存泄露了
            File file=new File(MyApplication.getInstance().getExternalFilesDir("dump"),UUID.randomUUID().toString()+PENDING_HEAPDUMP_SUFFIX);
            try {
                Debug.dumpHprofData(file.getAbsolutePath());
                //leakcanary启动一个服务去解析这个profile文件
                Intent intent = new Intent(MyApplication.getInstance(), HeapAnalyzerService.class);
                intent.putExtra(HEAPDUMP_EXTRA, file.getAbsolutePath());
                intent.putExtra(REFERENCE_KEY_EXTRA, weakReference.key);
                ContextCompat.startForegroundService(MyApplication.getInstance(), intent);

            } catch (IOException e) {
                e.printStackTrace();
            }
        }
    }

    private void removeWeaklyReachableReferences() {
        // WeakReferences are enqueued as soon as the object to which they point to becomes weakly
        // reachable. This is before finalization or garbage collection has actually happened.
        //正常情况下 如果一个对象不可达了,那么这个对象的弱引用就会被加入指定的ReferenceQueue(我们可以基于此去查询对象的内存状态)中
        KeyedWeakReference ref;
        while ((ref = (KeyedWeakReference) queue.poll()) != null) {
            //清空正常的引用对象的key。
            retainedKeys.remove(ref.key);
        }
    }
}
以上代码经过精简,等效改写,通过监听Activity和Fragment的onDestroy事件回调,给处于destroying的act或者fragment套上WeakReference,并指定一个ReferenceQueue去搜集,记住,这里延时5s了,打日志发现的5s,不延时5s,那搜集的poll( )是null,就认为是内存泄露,那是不准确的, 因为onActivityDestroyed和onFragmentDestroyed都是在super.onDestory方法里面调用的,此时act和fragment还可能是强引用,没被destoryed,那就给5s,时间够长,足够destroyed的了,再者如果系统GC没触发,那就手动触发一次运行时GC,此时检测才能确保正确性。
-
获取内存快照hprof文件
Debug.dumpHprofData(file.getAbsolutePath());
就是这么简单。
-
解析HeapDump文件
开启一个IntentService(HeapAnalyzerService)去解析dump文件,这个service很好的处理了android O及其以上的开启后台服务不被杀掉的问题。(下次遇到这种场景处理,就可以直接参考了,看源码的好处之一,)最后显示的话可以在另外一个Activity(DisplayLeakActivity)显示,这个act跟其他的不一样,在launcher以另外一个图标出现,方便查看,(组件化是不是可以参考下。)
ps: 怎么实现一个app,在launcher上出现两个图标呢?
<activity
    android:theme="@style/leak_canary_LeakCanary.Base"
    android:name=".internal.DisplayLeakActivity"
    android:process=":leakcanary"
    android:enabled="false"
    android:label="@string/leak_canary_display_activity_label"
    android:icon="@mipmap/leak_canary_icon"
    android:taskAffinity="com.squareup.leakcanary.${applicationId}"
    >
  <intent-filter>
    <action android:name="android.intent.action.MAIN"/>
    <category android:name="android.intent.category.LAUNCHER"/>
  </intent-filter>
</activity>
想要额外显示图标,当然得加intent-filter,加了就可以了。
<intent-filter>
    <action android:name="android.intent.action.MAIN"/>
    <category android:name="android.intent.category.LAUNCHER"/>
  </intent-filter>
process值是:冒号开头,说明是私有进程,
taskAffinity是一个新值,跟默认的不一致(默认是包名),
这样写就表示启动DisplayLeakActivity时是开一个新任务栈,
点击这个额外图标不是显示主app的界面,而是显示的是这个DisplayLeakActivity。
enable设置为false那怎么启用呢,代码改写其值为true。
android:enabled="false" 这个可以不加,我发现LeakCanary设计者在清单文件里面声明Activity或者Service时,都添加了这个flag,启动Activity或者Service时,先修改这个flag的值为true,再启动,这样写有啥好处?有知道的吗,烦请告知一下。
public static PendingIntent createPendingIntent(Context context, String referenceKey) {
setEnabledBlocking(context, DisplayLeakActivity.class, true);
Intent intent = new Intent(context, DisplayLeakActivity.class);
intent.putExtra(SHOW_LEAK_EXTRA, referenceKey);
intent.setFlags(Intent.FLAG_ACTIVITY_NEW_TASK | Intent.FLAG_ACTIVITY_CLEAR_TOP);
return PendingIntent.getActivity(context, 1, intent, FLAG_UPDATE_CURRENT);
}

public static void setEnabledBlocking(Context appContext, Class<?> componentClass,
  boolean enabled) {
ComponentName component = new ComponentName(appContext, componentClass);
PackageManager packageManager = appContext.getPackageManager();
int newState = enabled ? COMPONENT_ENABLED_STATE_ENABLED : COMPONENT_ENABLED_STATE_DISABLED;
// Blocks on IPC.
packageManager.setComponentEnabledSetting(component, newState, DONT_KILL_APP);
